







Description
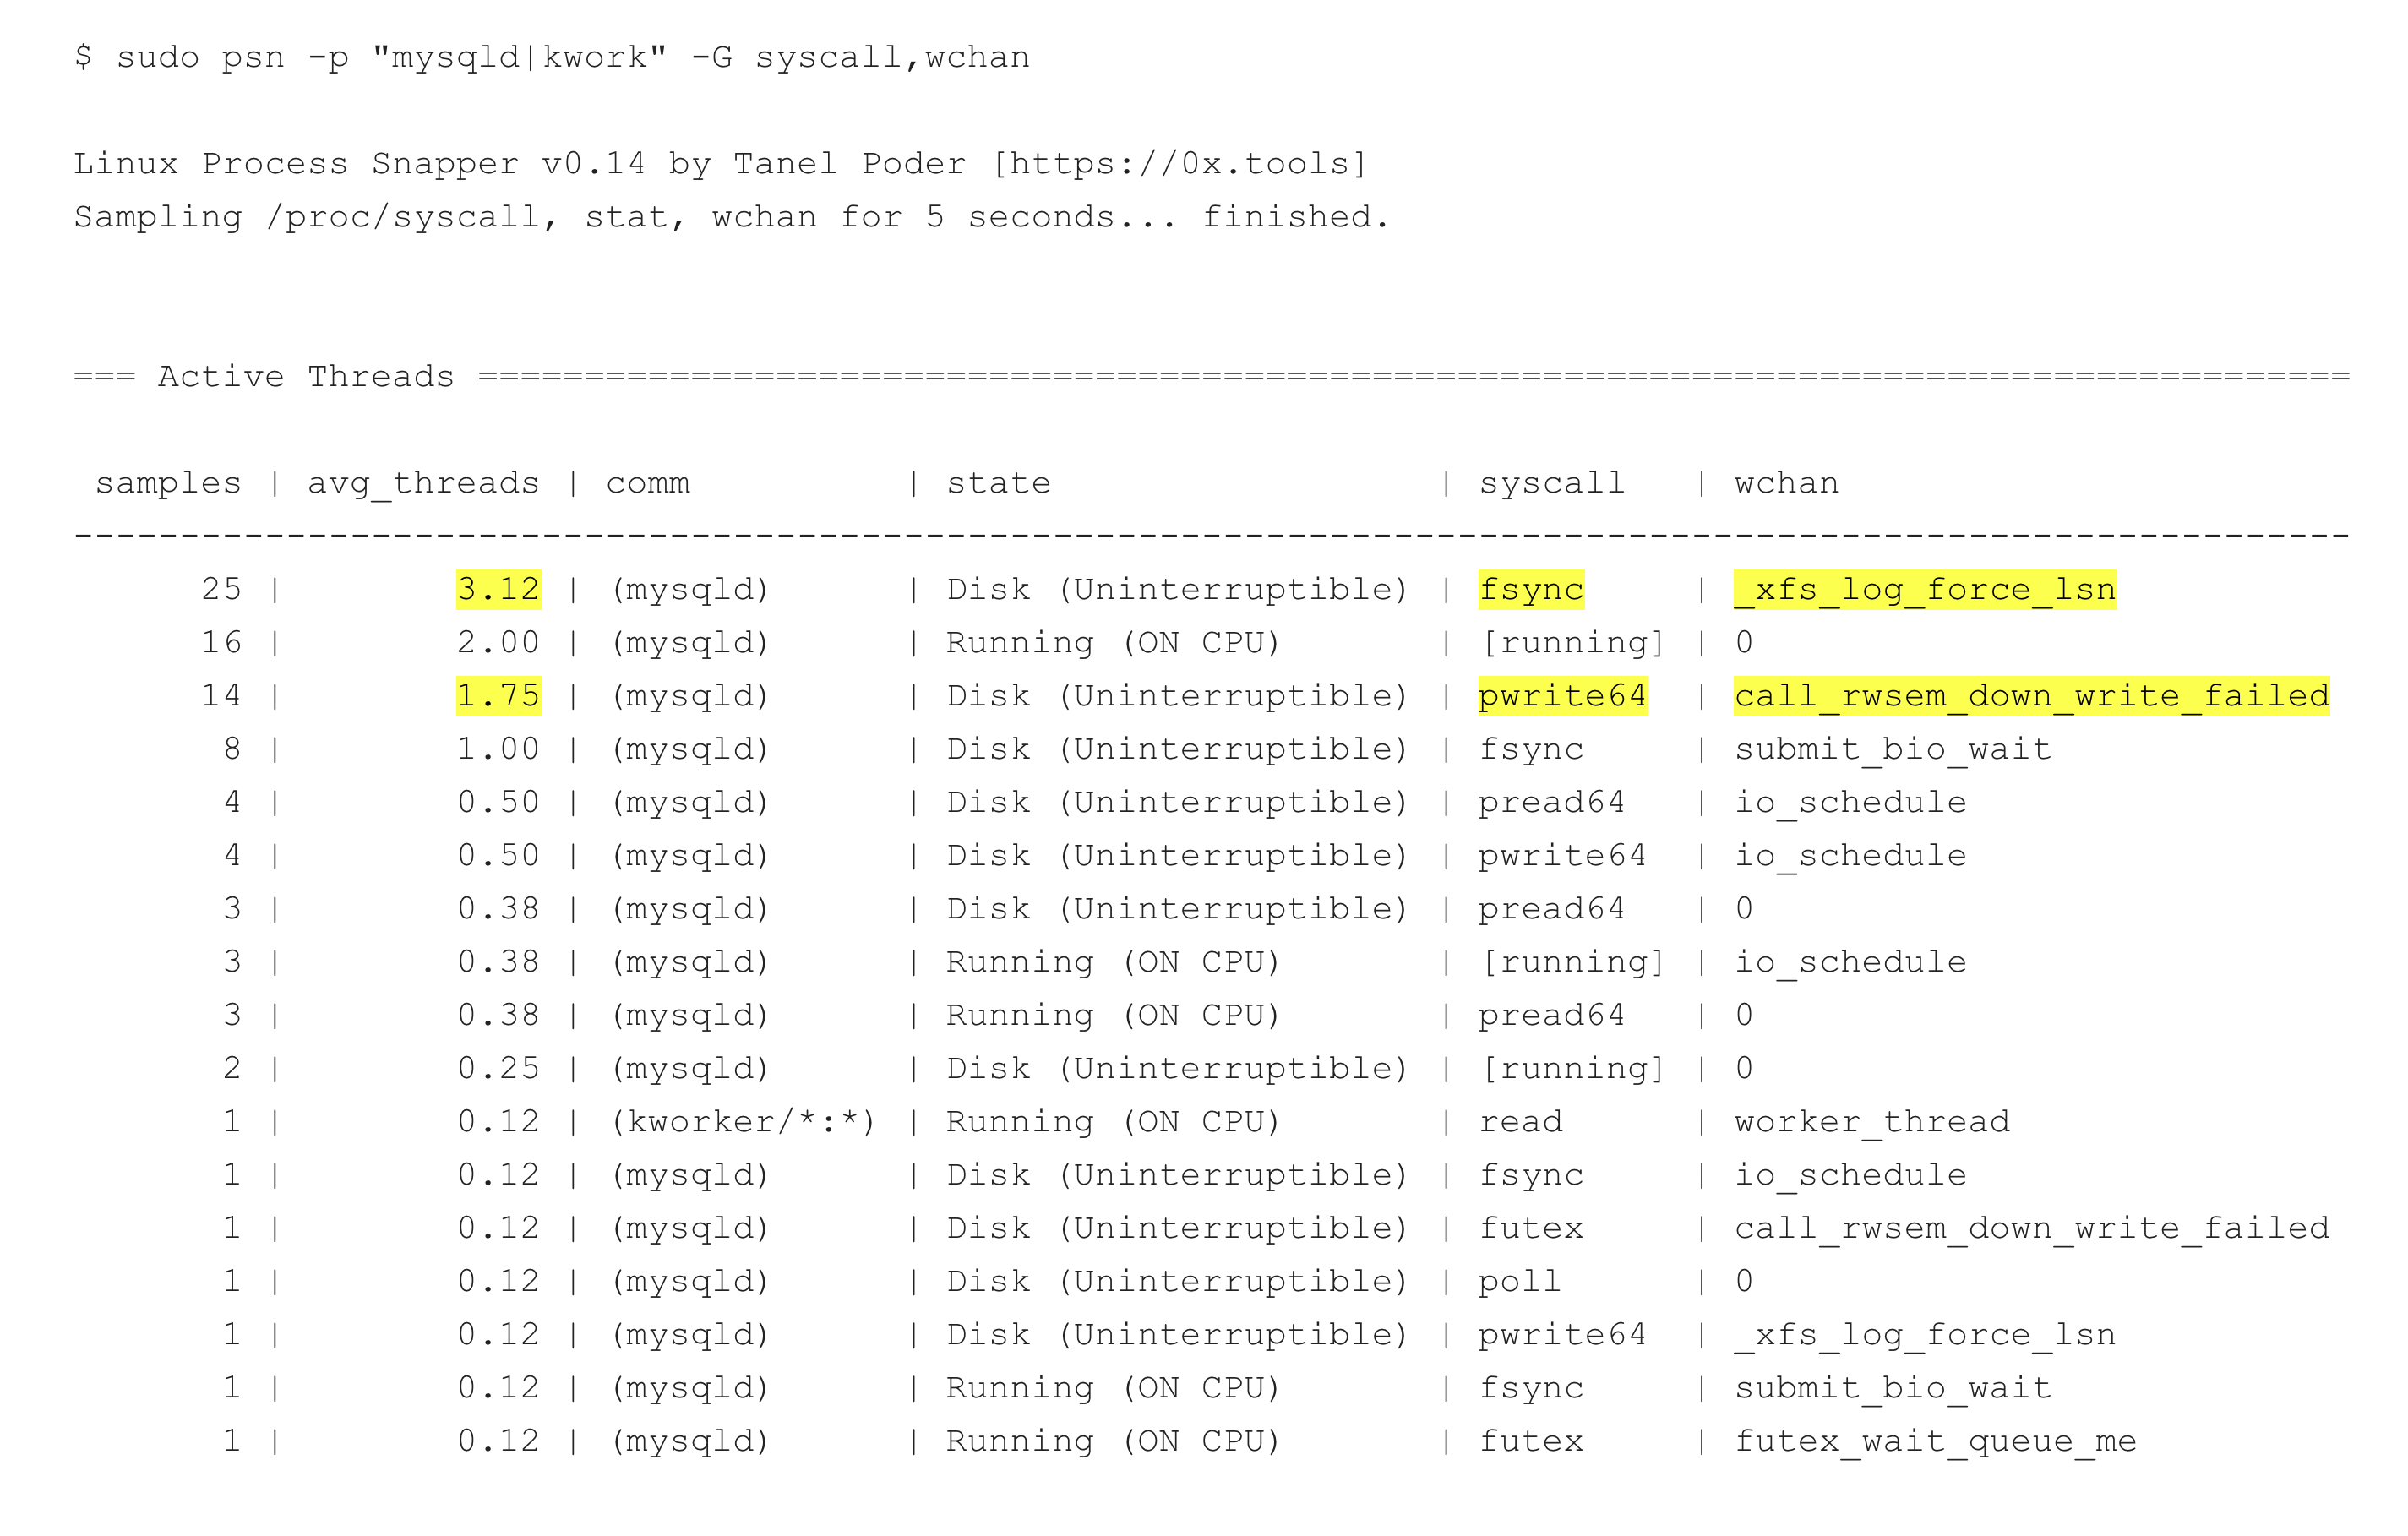
0x.tools is a set of open source utilities for analysing application performance on Linux, written by Tanel Poder. The goal is simple deployment with minimal dependencies, so you do not need to install kernel modules or a heavy monitoring framework to start troubleshooting. The tools measure activity at the level of individual threads, including executed code, sleep states, system calls and wait locations. They do this by tracking events and sampling them at the right moments, rather than tracing every event. The flagship tool, xtop, is like the Linux top command but adds wall-clock time views and can drill down into a thread's activity or into kernel events such as lock waits and memory stalls. Other included tools cover process snapshots, scheduler latency and CPU profiling. The site links to conference talks and short demonstrations, and it has an FAQ on licensing, measurement overhead and whether the tools are safe in production. The project lives on GitHub, where discussions are open.…
Highlights
- Thread-level performance measurement on Linux
- xtop: top for wall-clock time
- No kernel modules or heavy frameworks
- Process snapshots, scheduler latency and CPU profiling
- Conference talks and demos
Ratings & Reviews
No ratings yet
Be the first to rate 0x.tools.
People also visit
0x.tools FAQ
What is 0x.tools?
It is a set of open source utilities for analysing application performance on Linux. They help you see what threads are doing when your system is slow.
Do I need to install anything special?
The site says there is no need to install kernel modules or heavy monitoring frameworks, and the goal is minimal dependencies.
What is xtop?
xtop is a tool that works like the Linux top command but adds x-ray views, such as top for wall-clock time, and lets you drill into thread activity and kernel events.
Is it safe in production?
The site has a FAQ that covers this question along with the measurement overhead and licensing. Read it before running the tools on a production system.