Skip to content
qryn

Alternatives to qryn

200 apps like qryn, closest match first.

Top picks

  1. P

    promql-cli

    Get

    CLI for querying Prometheus and PromQL-compatible engines (Thanos, Cortex, VictoriaMetrics, Grafana Mimir, Grafana Tempo...) — instant queries, range queries,

  2. W

    WaveHouse

    Launch

    The open-source real-time API gateway for ClickHouse — schema-aware ingest, async batching, real-time streaming, and tiered query caching in a single binary.

  3. R

    RocketGraph

    Launch

    Ask your production stack anything in Slack. When alerts fire, a fix PR is already waiting. Full observability stack, zero config. Start free in 5 minutes.

  4. P

    pab1it0/prometheus-mcp-server

    Get

    Prometheus MCP Server is an open-source Model Context Protocol server that gives AI assistants access to a Prometheus monitoring system. Once it is connected, an assistant can run PromQL queries against your metrics and analyze the results.

  5. M

    mimir

    Get

    Stand up Grafana Mimir for horizontally scalable, multi-tenant, long-term Prometheus + OTLP metrics storage. Covers monolithic / read-write / microservices

  6. Q

    qdrant-monitoring

    Get

    A skill for AI coding agents that guides monitoring and observability setup for Qdrant. It routes each question to the right reference. Setting up Prometheus, Grafana or health checks, deciding which metrics to track, and setting up alertin

More like qryn

7
L

Logchef

Lightweight log analytics platform

Launch
8
L

LogQL

Observability for GraphQL APIs

Launch
9
C

Collector

pganalyze statistics collector for gathering PostgreSQL metrics and log data

Launch
10
R

Rootprint

Open-source, self-hosted logs and traces

Launch
11
P

Policy Reporter

Monitoring and Observability Tool for the PolicyReport CRD with an optional UI

Launch
12
D

DeadBro

Rails Performance Monitoring & Error Tracking

Launch
13
C

Chmonitor

Open-source operational advisor for ClickHouse

Launch
14
K

KairosDB

Store, query, and analyze metric data

Launch
15
B

bigquery-observability

Provides data-retrieval best practices, tool selection guidance

Get
16
M

Middleware

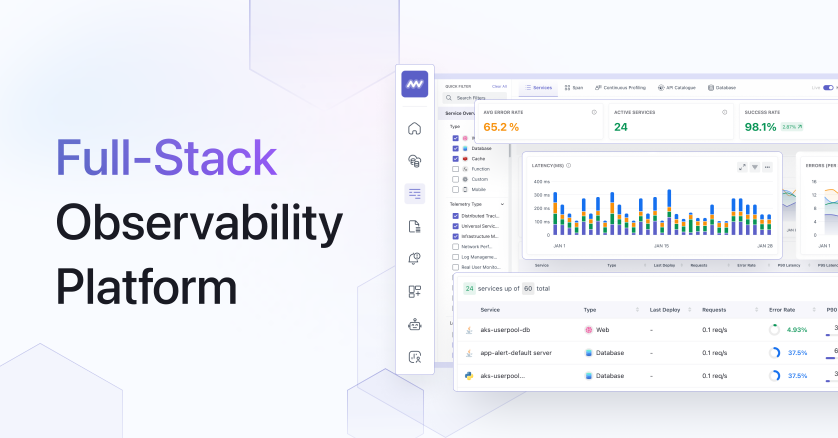
Full-stack Observability With AI SRE Agent

Launch
17
T

TalkToMyDB

It allows you to chat with your BigQuery DB instead of querying it! No more SQL

Launch
18
A

app-observability

Get RED metrics + service maps + frontend RUM + AI/LLM monitoring out of Grafana

Get
19
P

prometheus

Prometheus and Grafana Cloud Metrics overview including PromQL query language

Get
20
P

Polylane

AI agents that fix production before you wake up

Launch
21
Z

Zinc

Comprehensive observability for logs, metrics, and traces

Launch
22
C

cloud-monitoring-promql-query

Generates valid PromQL queries from Cloud Monitoring metric descriptors

Get
23
G

Gigapipe

Unified platform for logs, metrics, traces and profiles

Launch
24
A

Agx

AI Powered Analytics

Launch
25
M

monitoring-expert

Configures monitoring systems, implements structured logging pipelines

Get
26
T

Tinybird

Interact with Tinybird serverless ClickHouse platform

Get
27
G

GreptimeTeam/greptimedb-mcp-server

Query GreptimeDB

Get
28
P

pydantic/logfire-mcp

Access OpenTelemetry traces and metrics through Logfire

Get
29
M

MetriQL

Headless business intelligence suite

Launch
30
B

Bleemeo

Modern Infrastructure Monitoring

Launch
31
I

Insights

Open Source Self-Hosted Business Intelligence Platform

Launch
32
D

Dory

AI-native SQL client for humans and agents

Launch
33
T

traceloop/opentelemetry-mcp-server

Connect to any OpenTelemetry backend, such as Datadog, Grafana
Get
34
P

PostHog

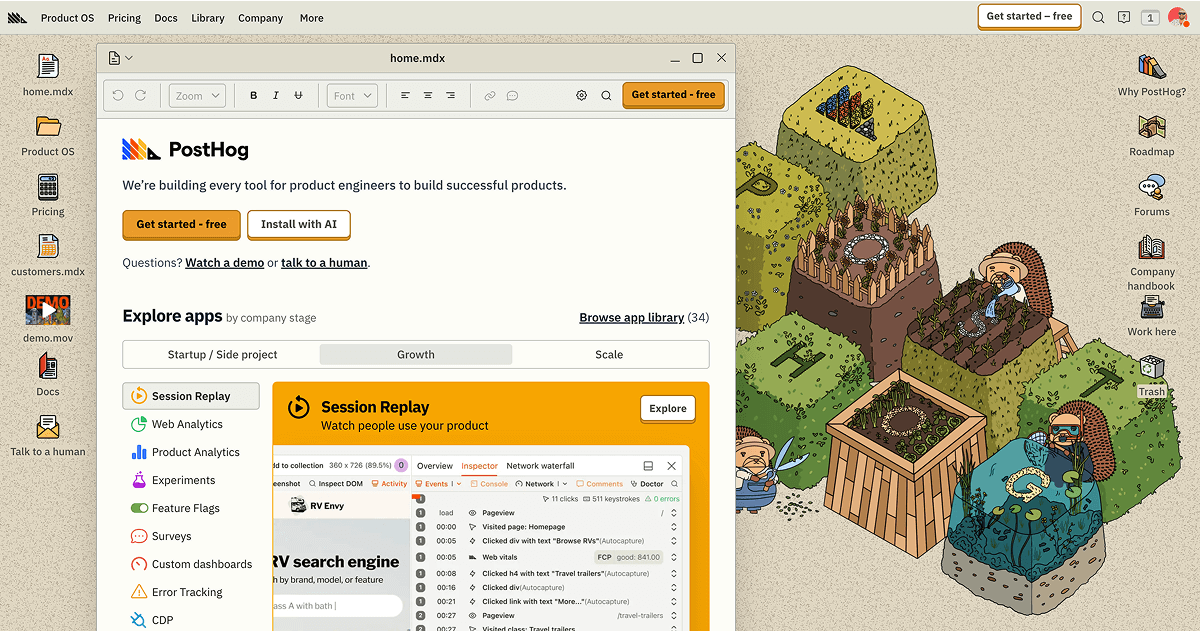
Analytics with autocapture, session recordings, feature flags, heatmaps and more

Launch
35
A

Apitally

API monitoring & analytics made simple

Launch
36
C

convex-insights

Query a running Convex app's logs + health in natural language

Get
37
Q

QueryFuser

Reduce BigQuery bytes scanned with query merging

Launch
38
Q

query-metrics

Runs metrics queries against Axiom MetricsDB via scripts

Get
39
D

dpm-finder

Find the Prometheus metrics that drive your Grafana Cloud bill

Get
40
I

IOpipe

AWS Lambda Monitoring + Observability

Launch
41
P

prometheus-label-strategy

Expert evaluator for Prometheus label strategy on Grafana Cloud

Get
42
D

data-analyst

Act as an interactive data analyst for ClickHouse-backed analytics

Get
43
H

hypequery

The TypeScript analytics layer for ClickHouse

Launch
44
C

Clickvisual

A lightweight log analytic and data visualize platform built on clickhouse

Launch
45
T

Telescope

Web-based log viewer UI

Launch
46
A

azure-kusto

Execute KQL queries and analyze data in Azure Data Explorer for log analytics

Get
47
F

Flowg

Low Code / Visual Scripting log processing software

Launch
48
N

Nerdlog

Fast, remote-first, multi-host TUI log viewer

Launch
49
N

NexusPilot

AI-native cross-platform database workbench for developers and data teams

Launch
50
S

SigNoz MCP Server

Access metrics, traces, logs, alerts, and dashboards

Get

About qryn

Q

qryn

polyglot observability

qryn is an open-source observability stack that stores logs, metrics, traces and profiles in ClickHouse. It is built to be drop-in compatible with Loki, Prometheus, Tempo and Pyroscope, and it ingests data from OpenTelemetry, InfluxDB, Datadog and Elastic. You query it with LogQL, PromQL and TempoQL, and explore data with a built-in Explorer and CLI or a native Grafana datasource. The server runs on Bun and can keep data in ClickHouse, DuckDB or InfluxDB IOx with S3 object storage, so you control where your data lives. The project is community-run and takes no outside funding. Companies that use it are asked to support it through GitHub Sponsors or the commercial edition, and a hosted qryn.cloud option with extra features is also offered.

Price
Free
Category
Developer Tools
Website
qryn.dev