200 apps like Topological visualizations, closest match first.
chart-designer
Design effective data visualizations and charts
Inkarnate
Create custom fantasy maps
mapbox-style-quality
Expert guidance on validating, optimizing
OSINT-Mapping-Tool
An OSINT Mapping tool for research
data-visualization
Select chart types and design data encodings
globe-particles
Create a globe-like 3D particle visualization
antv-g2-chart
Create, customize, or troubleshoot G2 v5 chart visualizations
PensievePixel
Draw Ideas, Visualize Data, Bring Concepts to Life!
Maptoposter Online
Turn the cities you love into stunning designs
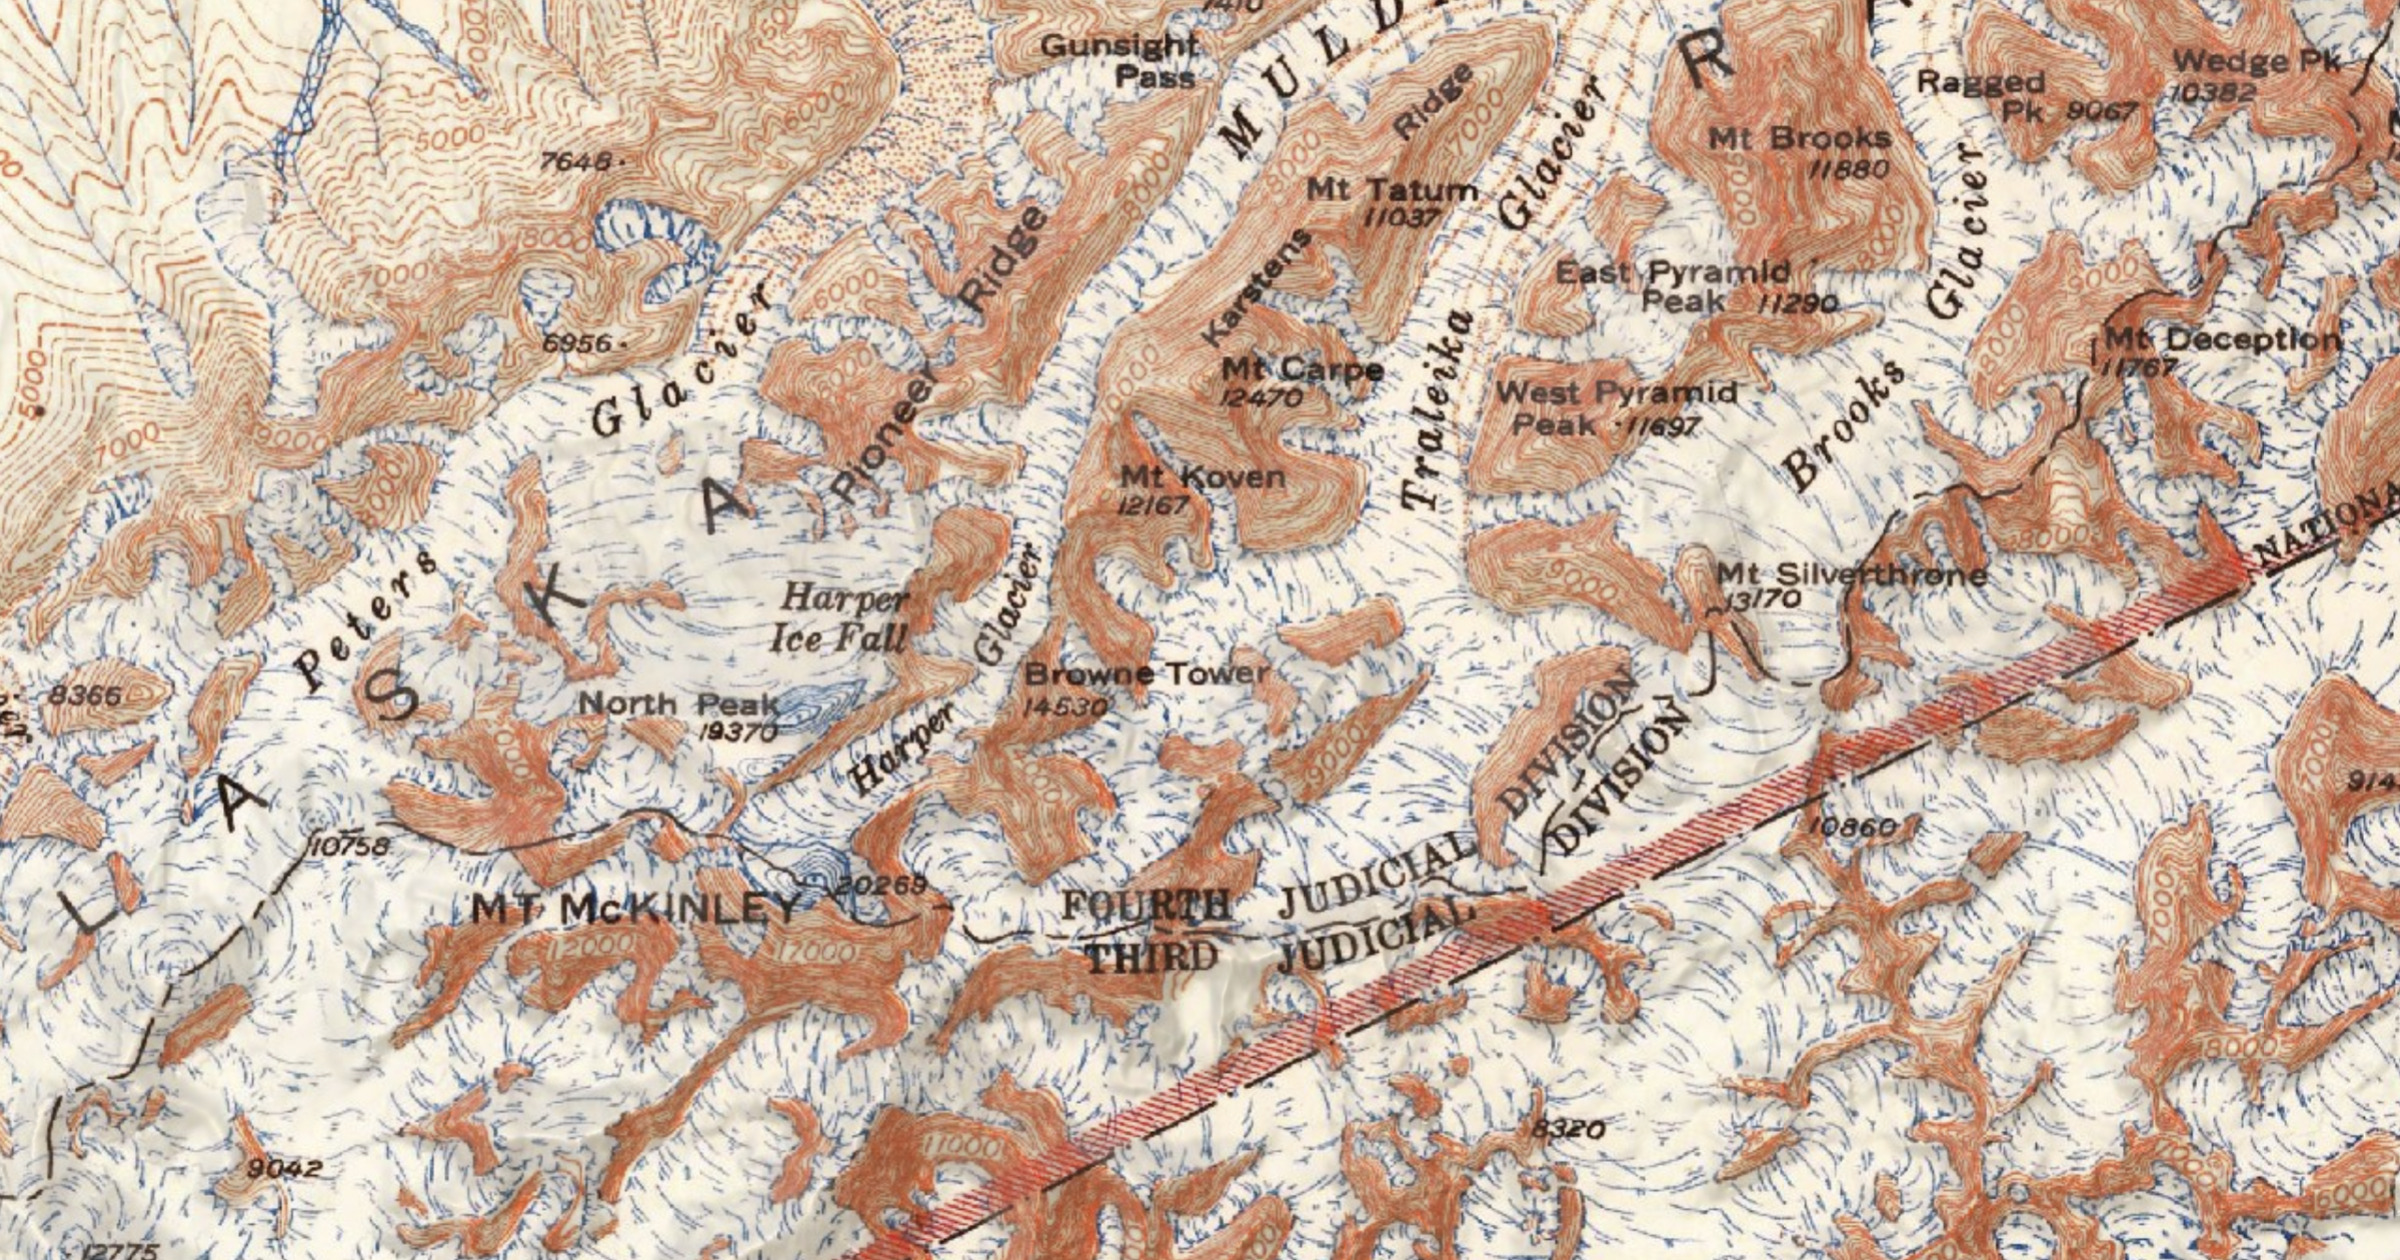
Usgs-topo-mosaic
Serverless USGS Historical Topographic Map tiles
Treeverse
Visualize Bluesky conversations as a tree
VizGPT
Create stunning data visualizations effortlessly
All roads lead home
Make a map no one else could make
ChartGPT
Generate stunning, interactive charts from text-based data
Firegraph
Create beautiful graphs
chart-visualization
Visualize data. It intelligently selects the most suitable chart type
React Native Map Link
Open the map app of the user's choice
plannotator-visual-explainer
Generate self-contained HTML visualizations with Plannotator theming
PingPoint
Visualize Pings on a Map
AvoMap
Create 3D videos of your adventures
vega
Create data-driven charts with Vega-Lite (declarative) and Vega (programmatic)
Rover
Interactive Terraform visualization. State and configuration explorer
ScribbleMaps
Create custom google maps
shadcnmaps
Beautiful map components powered by pure SVG
OsmAPP
Lets make a universal app for OpenStreetMap
Infinity Maps
If Miro and Notion had a baby
generative-ui
Design system and templates for Claude's built-in generative UI
FigPad AI
A research-focused tool for creating scientific figures from text and sketches
Highcharts
Create intuitive, secure visuals using natural language processing
industrial-brutalist-ui
Raw mechanical interfaces fusing Swiss typography
PeakMap
PEAK daily map, luggage and other locations. Data generator & website
FeatureMap
Multilingual web tool for teams to visually organize project ideas
Magrit
Thematic cartography entirely in the browser
hustcc/mcp-echarts
Generate visual charts dynamically using Apache ECharts
Flutter Maplibre
Permissive and performant vector and raster maps
scientific-visualization
Create publication figures with matplotlib/seaborn/plotly
Graphrag Visualizer
A web-based tool for visualizing and exploring artifacts
Dreamspace.art
Create stunning diagrams, collaborate in real-time
Maps GPT
Maps GPT turns your ideas into custom-made maps for any location or interest
react-flow
React Flow (@xyflow/react) for workflow visualization
County Health Mapper
Enter county-level public health data
KyuRish/mcp-dashboards
Interactive charts (bar, line, candlestick, Sankey, geo and more)
SCpubr
Generate high quality, publication ready visualizations
Depict.ai
Easily create and share interactive visuals tailored to your business
figure-generation
Generate publication-quality scientific figures using matplotlib/seaborn
Carto
Map, analyze, and visualize geospatial data effortlessly while securely tracking
canvas
Create spatial diagrams with free-positioned nodes using JSON format
SciDraw AI
AI Scientific Graphics Platform
mapkit
Implement, review, or improve maps and location features in iOS/macOS apps
mapbox-mcp-devkit-patterns
Integration patterns for Mapbox MCP DevKit Server in AI coding assistants