Skip to content
Uptrace

Alternatives to Uptrace

200 apps like Uptrace, closest match first.

Top picks

  1. S

    Signoz

    Launch

    SigNoz is an observability platform built on OpenTelemetry that brings APM, logs, traces, metrics, exceptions, alerts and LLM observability into one tool. You can see P99 latency, Apdex and database and external calls for each service, sear

  2. T

    Traceway

    Launch

    Traceway is an open-source observability platform built around OpenTelemetry. It brings logs, traces, metrics, session replay, exceptions and AI tracing into one place, with search across OpenTelemetry spans and waterfalls that follow a req

  3. G

    Grafana Cloud

    Launch

    Grafana Cloud is a fully managed observability platform that brings metrics, logs, traces, profiles and dashboards into one place. It is built on leading open-source tools and is OpenTelemetry-native. Adaptive Telemetry helps keep costs und

  4. O

    OpenObserve

    Launch

    OpenObserve is an open-source observability platform for logs, metrics, traces, real user monitoring, session replay and error tracking. It is built to keep large volumes of logs cheaply, and the site says it stores a year of logs on a frac

  5. Z

    Zinc

    Launch

    OpenObserve is a full-stack observability platform designed to monitor and analyze your entire infrastructure. It unifies logs, metrics, and traces into a single, easy-to-use interface, eliminating the need for multiple tools.

  6. K

    KloudMate

    Launch

    Logs, metrics, and traces in one platform. KloudMate helps engineers find and fix issues fast. Ask the built-in AI assistant to help track down the cause.

More like Uptrace

7
H

Hypertrace

An open source distributed tracing & observability platform

Launch
8
H

HyperDX

Open-source, dev-friendly observability

Launch
9
G

Gigapipe

Unified platform for logs, metrics, traces and profiles

Launch
10
L

Logfire

Logfire offers intuitive observability tools

Launch
11
V

VictoriaMetrics

Application monitoring and observability platform

Launch
12
O

OneUptime

All-in-one solution for uptime monitoring, incident management

Launch
13
B

Bilis

Self-hosted logs and traces with AI-powered observability

Launch
14
D

Dynatrace Operator

Automate Kubernetes observability with Dynatrace

Launch
15
D

Dash0

OpenTelemetry Native Observability

Launch
16
N

NewRelic

New Relic is a Software Analytics company

Launch
17
V

VedaTrace

Simple, edge-powered logging that gives you the fix, not the bloat

Launch
18
A

Atatus

Next-gen observability for modern systems

Launch
19
K

Kamon

Distributed Tracing, Metrics and Context Propagation

Launch
20
C

Coroot

Coroot simplifies system monitoring

Launch
21
M

Monoscope

Monoscope lets you ingest and explore your logs, traces and metrics

Launch
22
L

Loggy

Simple, beautiful observability for your apps

Launch
23
M

Middleware

Full-stack Observability With AI SRE Agent

Launch
24
G

GlitchTip

Self-hostable error tracking platform compatible with Sentry SDKs

Launch
25
G

GreptimeDB

Cloud-native observability database unifying metrics, logs, and traces

Launch
26
F

Fastapi Observability

Observe FastAPI app with three pillars of observability: Traces

Launch
27
G

groundcover

Observability, for the Cloud

Launch
28
P

Pyroscope

Debug performance issues down to a single line of code

Launch
29
S

Sentry

Error tracking and performance monitoring

Launch
30
B

Bleemeo

Modern Infrastructure Monitoring

Launch
31
H

Highlight

Comprehensive monitoring solution offering error tracking, session replay

Launch
32
T

traceloop/opentelemetry-mcp-server

Connect to any OpenTelemetry backend, such as Datadog, Grafana

Get
33
O

Opentelemetry Collector

OpenTelemetry Collector

Launch
34
D

Dashbird

End-to-end observability & debugging platform for serverless applications

Launch
35
T

Telebugs

A lightweight, self-hosted Sentry alternative without a subscription

Launch
36
J

Jaeger UI

Web UI for Jaeger

Launch
37
S

Simple Observability

Server Monitoring Made Simple

Launch
38
S

Sentry Self-Hosted

Powerful error tracking platform with wide language support and a robust API

Launch
39
I

IOpipe

AWS Lambda Monitoring + Observability

Launch
40
V

Venator

A desktop app for viewing logs and traces from OpenTelemetry

Launch
41
L

Lumigo

With one-click distributed tracing

Launch
42
R

RocketGraph

Agent layer for observability

Launch
43
S

Sensu Go

Simple. Scalable. Multi-cloud monitoring

Launch
44
O

OpenStatus

Synthetic monitoring platform

Launch
45
M

monitoring-observability

Monitoring and observability strategy, metrics/logs/traces systems

Get
46
R

Rootprint

Open-source, self-hosted logs and traces

Launch
47
P

Podtrace

eBPF-driven APM and diagnostic tool for Kubernetes applications

Launch
48
P

Parseable

Parseable is an open source, unified infrastructure observability platform…

Launch
49
Z

Zabbix

Monitors networks, servers, cloud services, IoT, and OT environments

Launch
50
R

Rustrak

Ultra-lightweight error tracking server compatible with Sentry SDKs

Launch

About Uptrace

U

Uptrace

Application monitoring and observability platform

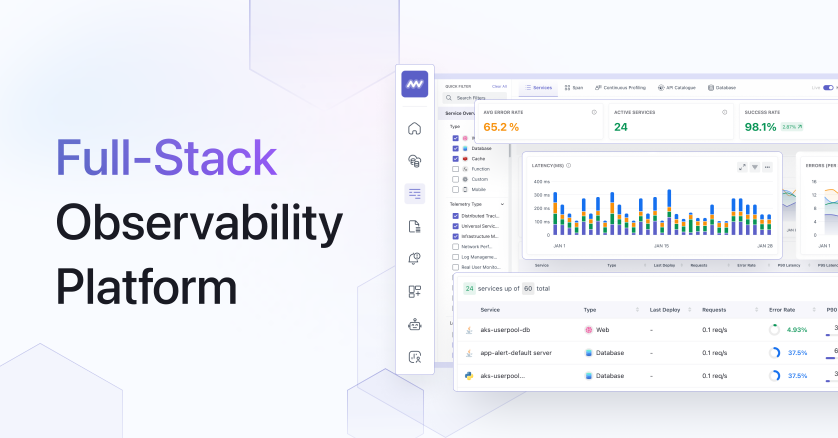
Uptrace is an observability platform that brings traces, metrics and logs into one place, built on OpenTelemetry and ClickHouse. It can be used for application performance monitoring, infrastructure monitoring and alerting, and it has an MCP feature so AI tools can query your telemetry. You can ask questions of your data in plain text. The company prices its cloud by data size instead of by span count: spans cost $0.01 per GB a month, and metrics cost $1 per 1,000 active timeseries, where a timeseries is a metric with a unique set of labels. Uptrace Cloud keeps data for 28 days by default, and longer retention is possible by storing data on cold storage such as S3 or an HDD. You can also self-host Uptrace for free, deploying it on your own servers. The team is based in the EU, with servers in Germany and Finland, and the source code is on GitHub.



Price
Open source
Category
Developer Tools
Website
uptrace.dev