Skip to content
Wachd

Alternatives to Wachd

200 apps like Wachd, closest match first.

Top picks

  1. M

    monitoring-expert

    Get

    monitoring-expert is an agent skill from the jeffallan claude-skills collection for configuring monitoring systems, structured logging pipelines, Prometheus and Grafana dashboards, alerting rules and tracing. Its persona is an observability

  2. S

    Spectate

    Launch

    Spectate is an uptime monitoring and incident management tool from the Netherlands. It checks websites, APIs, servers, certificates and domains from four regions, and it pages the right person through escalation paths and on-call schedules.

  3. A

    app-observability

    Get

    Get RED metrics + service maps + frontend RUM + AI/LLM monitoring out of Grafana Cloud — Application Observability (`traces_spanmetrics_*` from OTel traces,

  4. A

    agent-platform-alert-configuration

    Get

    Configures best-practice alerting policies for AI agents using OpenTelemetry (OTel) metrics, generating output as Terraform (.tf) configuration files. Use when

  5. M

    mimir

    Get

    Stand up Grafana Mimir for horizontally scalable, multi-tenant, long-term Prometheus + OTLP metrics storage. Covers monolithic / read-write / microservices

  6. A

    Alertmanager2es

    Launch

    alertmanager2es is a daemon that receives Prometheus Alertmanager webhook notifications and writes them into an Elasticsearch index. Once the alerts are stored, you can search and analyse them, for example to see which alerts fired over a g

More like Wachd

7
R

RocketGraph

Agent layer for observability

Launch
8
C

Calert

Send alert notifications to Google Chat via Prometheus Alertmanager

Launch
9
A

axiom-alerting

Create and manage Axiom monitors and notifiers via the v2 public API

Get
10
C

cloud-integrations

Set up, configure, and troubleshoot Grafana Cloud integrations for AWS, Azure

Get
11
I

iLert

AI-first platform for alerting, on-call management, and status pages

Launch
12
D

dpm-finder

Find the Prometheus metrics that drive your Grafana Cloud bill

Get
13
D

dd-docs

Datadog docs lookup using docs.datadoghq.com/llms.txt and linked Markdown pages

Get
14
P

prometheus-label-strategy

Expert evaluator for Prometheus label strategy on Grafana Cloud

Get
15
S

SigNoz MCP Server

Access metrics, traces, logs, alerts, and dashboards

Get
16
P

pab1it0/prometheus-mcp-server

Query and analyze Prometheus, the open-source monitoring system

Get
17
B

Bleemeo

Modern Infrastructure Monitoring

Launch
18
C

cloud-monitoring-chart-generation

Generates Cloud Monitoring Server-Driven UI

Get
19
G

gke-alert-configuration

Configures alerting policies in Terraform for Google Kubernetes Engine

Get
20
C

cloud-run-alert-configuration

Configures best-practice, high-signal alerting policies

Get
21
C

cx-dashboards

Build and deploy a Coralogix dashboard for a given service from its logs, spans

Get
22
A

alerting-irm

Configure Grafana Alerting, Incident Response Management

Get
23
A

AiSOC

Open-source AI Security Operations Center: alert fusion, LLM-agent triage

Launch
24
A

Apitally

API monitoring & analytics made simple

Launch
25
A

Anodot

Detect and alert anomalies in web apps, monitor cloud infrastructure

Launch
26
D

dtctl

Investigate incidents, debug performance issues, analyze logs

Get
27
D

dd-monitors

Monitor management

Get
28
E

EasyMonitor

Deploy your own uptime and performance monitoring

Launch
29
T

traceloop/opentelemetry-mcp-server

Connect to any OpenTelemetry backend, such as Datadog, Grafana

Get
30
C

Calmo

Debug Production x10 Faster with AI

Launch
31
O

OpenStatus

Synthetic monitoring platform

Launch
32
L

Legend

Legend builds and publishes Grafana dashboards for your services

Launch
33
I

IMPulse

ChatOps Incident Management

Launch
34
D

dynatrace-oss/dynatrace-managed-mcp

Query problems, logs, events, SLOs

Get
35
C

Chmonitor

Open-source operational advisor for ClickHouse

Launch
36
M

Middleware

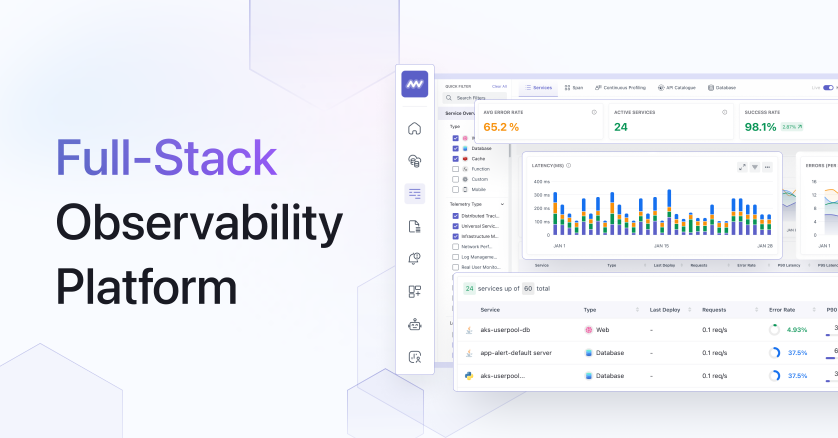
Full-stack Observability With AI SRE Agent

Launch
37
R

RobinRelay

Your AI On-Call Copilot in Slack

Launch
38
O

OpsiMate

Open-source alert management for NOC/DevOps teams: one queue for Grafana

Launch
39
P

prometheus

Prometheus and Grafana Cloud Metrics overview including PromQL query language

Get
40
P

promql-cli

CLI for querying Prometheus and PromQL-compatible engines

Get
41
D

dt-alerting

End-to-end Dynatrace alerting lifecycle

Get
42
K

kibana-connectors

Create and manage Kibana connectors for Slack, PagerDuty, Jira, webhooks

Get
43
M

ml-ai

Turn on AI + ML features in Grafana Cloud

Get
44
T

troubleshooting-application-failures

Troubleshoots failing applications

Get
45
D

dashboard-builder

Build monitoring dashboards

Get
46
L

LogQL

Observability for GraphQL APIs

Launch
47
F

Flawless

AI SRE AgenticOps for Kubernetes and cloud infrastructure

Launch
48
A

AlertKick

On-Call, Escalation Policies & Paging Priced Per Server

Launch
49
D

datadog-labs/dd-docs

Look up Datadog documentation via the LLM-optimized docs index

Get
50
S

Semaphore UI

Web interface for popular DevOps tools

Launch

About Wachd

W

Wachd

Receive alerts from Grafana, Datadog, and Prometheus

Wachd is a self-hosted on-call tool that tells an engineer why an alert fired, not just that it fired. It receives alerts from Grafana, Datadog and Prometheus through a webhook, then collects context before the page reaches anyone: the last ten commits from GitHub, thirty minutes of error logs from Loki or Datadog, and metric history around the alert window. An AI step analyses that causal timeline and writes a plain-English root cause with a suggested action. The model can run inside your cluster through Ollama, vLLM or any OpenAI-compatible server, or be Claude, OpenAI or Gemini. Personal data is stripped before the model sees anything. Notifications go out by SMS, voice call, email and Slack in the order you configure, with escalation if nobody acknowledges, and they are cancelled once the problem is resolved. Schedules support primary, secondary and custom rotation layers, time windows for business hours, nights and weekends, and self-service overrides. Each person can set their own notification rules. Wachd runs on Kubernetes and can work air-gapped, with single sign-on or local users, multi-tenant isolation and CVE tracking. The code is licensed under Apache 2.0 on GitHub, and a live demo is available.

Price
Open source
Category
AI
Website
wachd.io