what is data hit? five free tools for search demand, ga4 and ai answers
data hit is a uk analytics consultancy that turned the charts it kept wanting for clients into free tools. here's what each one does, what costs money, and who it suits.
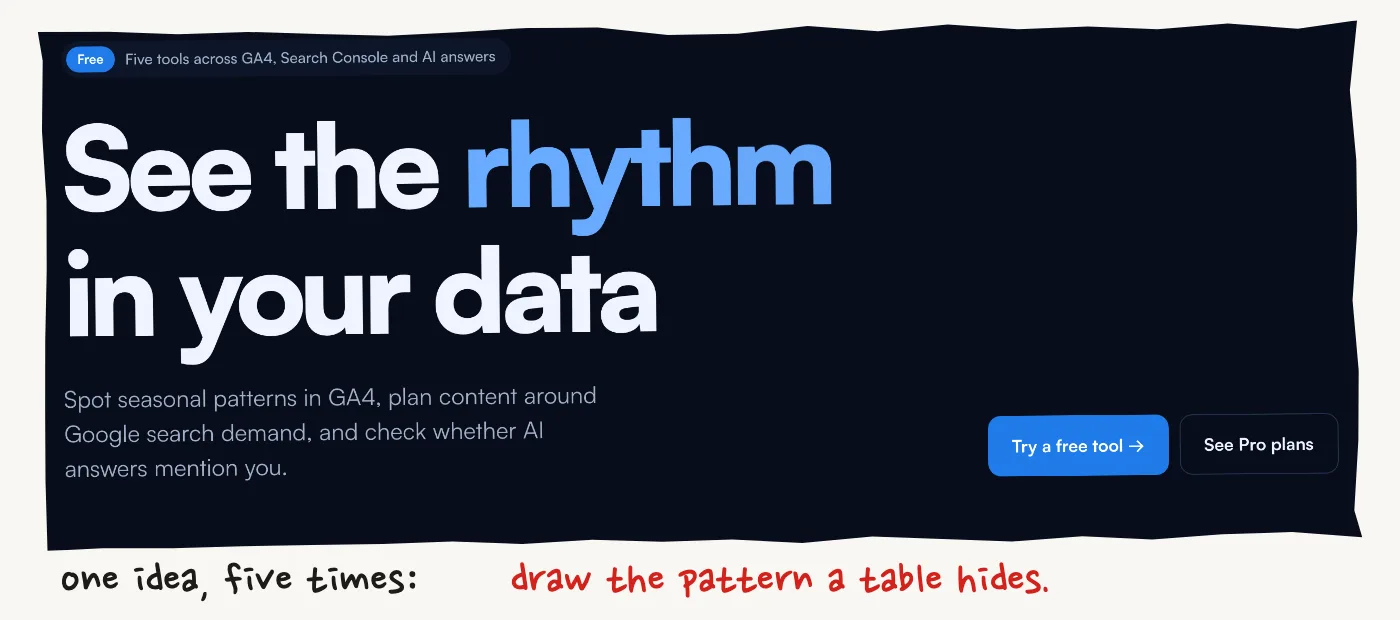
data hit is a uk analytics consultancy. data hit tools is the set of five charts it built out of that client work, and every one of them can be tried free.
they answer questions a normal report makes you dig for: when demand rises, when your traffic moves, and how often an ai names you.
there are two sides to the name, so here's each one.
the consultancy
matthew redford founded data hit in 2024, after more than 15 years on the agency and client side.
the work is analytics and tracking for small and medium businesses: roadmaps, tag setup across web and app, data pipelines that replace manual exports, and reporting. the stack runs from ga4 and google tag manager, web and server, to consent tools, bigquery and testing platforms. agencies can also hire it for overflow or white-label work.
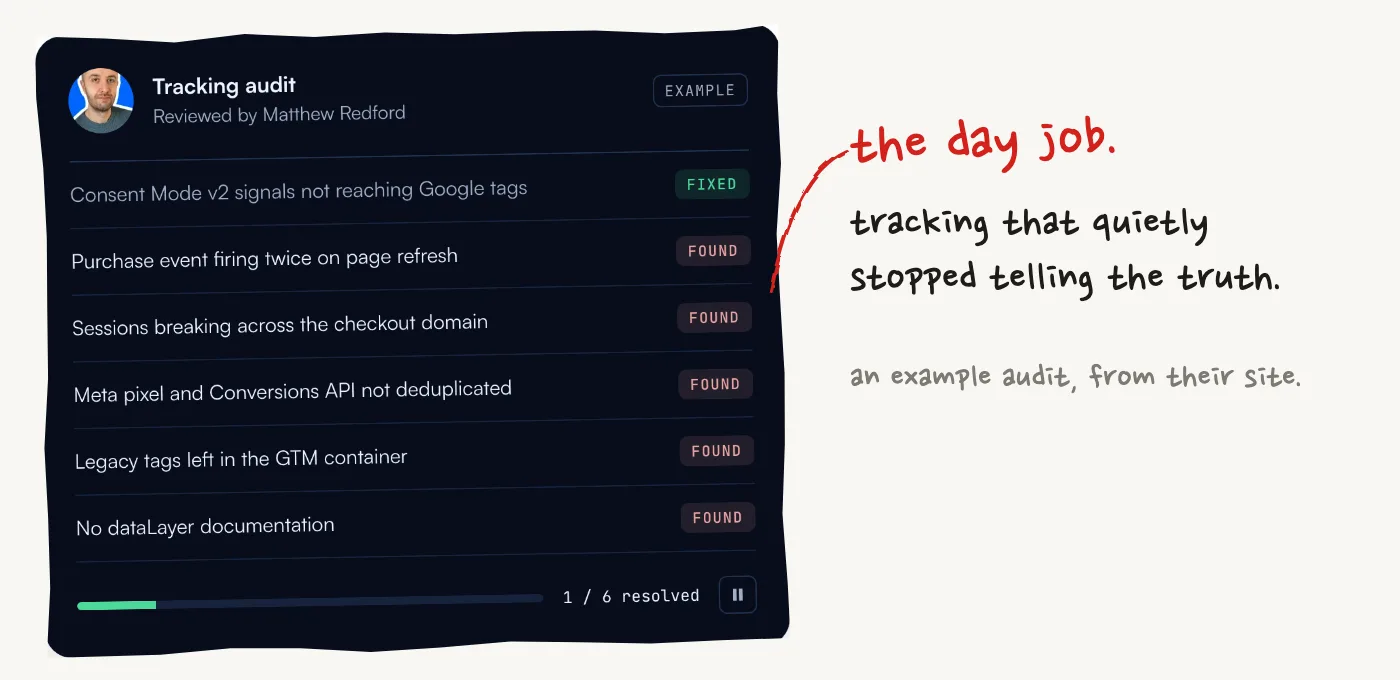
data hit is a certified partner of addingwell, stape and taggrs, and every project comes with three months of tools pro.
the about page explains where the tools came from: these were charts the team kept wanting in client work and couldn't find, so they built them and made them public.
the five tools
each tool answers one question.
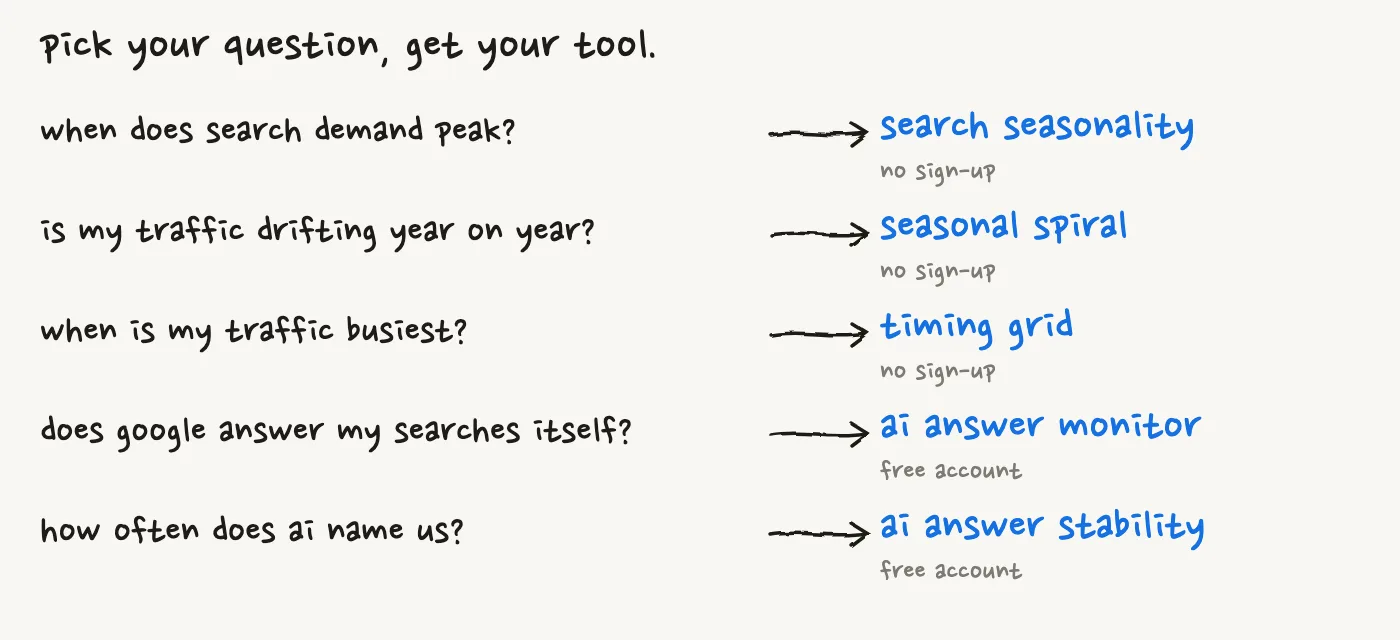
search seasonality
search seasonality shows about eight years of monthly google searches for any keyword, in 11 countries. you get the peak month, when the rise starts, and whether the keyword is growing.
a free account turns a list of 10 keywords into a calendar sorted by peak month.
seasonal spiral
seasonal spiral takes daily ga4, search console or csv data and winds it into a spiral, one turn per year. the same week sits at the same angle every year, so a summer dip or a sale spike lines up across rings.
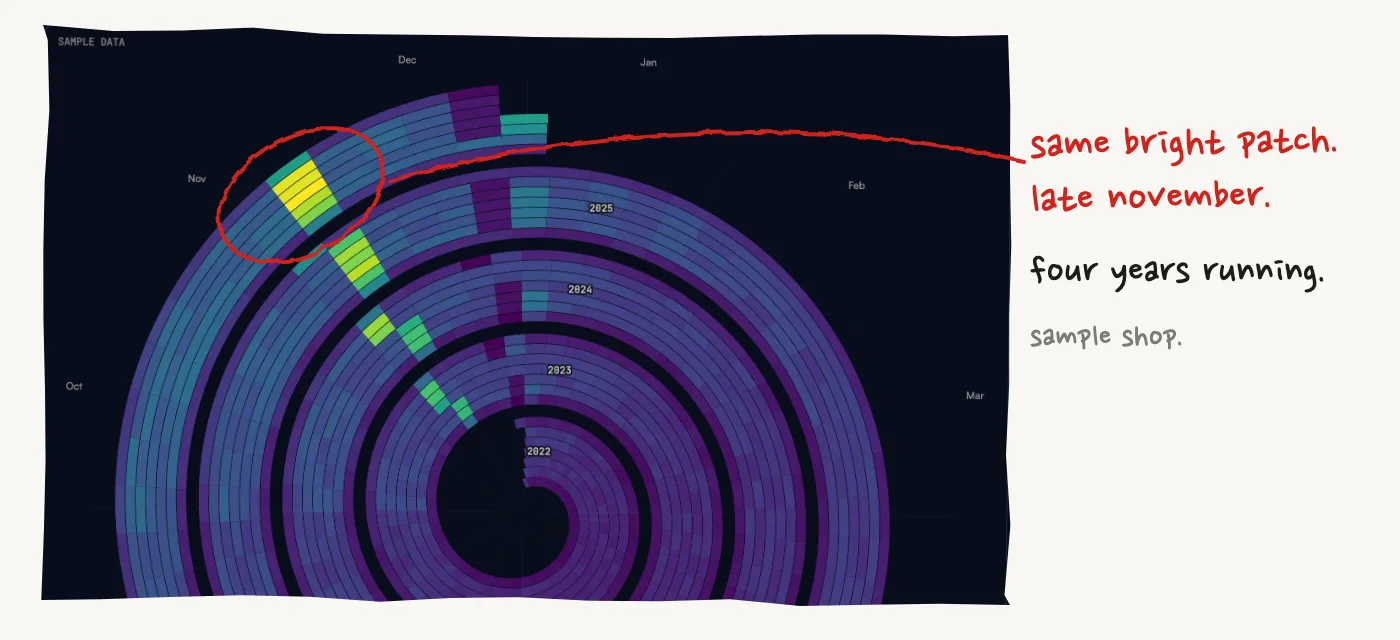
it's worth a look if you already know your headline numbers and want the pattern under them.
timing grid
timing grid lays ga4 traffic out by day of week and hour of day. use it to decide when to run ads, send email or post. it can also show engagement, so you can see the slots where people stick around.
ai answer monitor
ai answer monitor asks how much of your search demand google now answers itself. put in your domain and you get your search terms, marked by whether google shows an ai answer and whether that answer links to you. on a big site it covers your top terms by volume.
when it doesn't link to you, one click asks chatgpt the same search, so you can read what it says and who it names instead.
ai answer stability
ai answer stability is in beta. it asks chatgpt, gemini, perplexity, claude and google ai mode the same question several times and counts how often each one names you.
you get a rate with a 95% interval, plus how often you're named first and which sites each engine cited. a free account runs about 3 of these a month.
what pro adds
the free side is for looking things up. tools pro adds the parts that keep running without you.
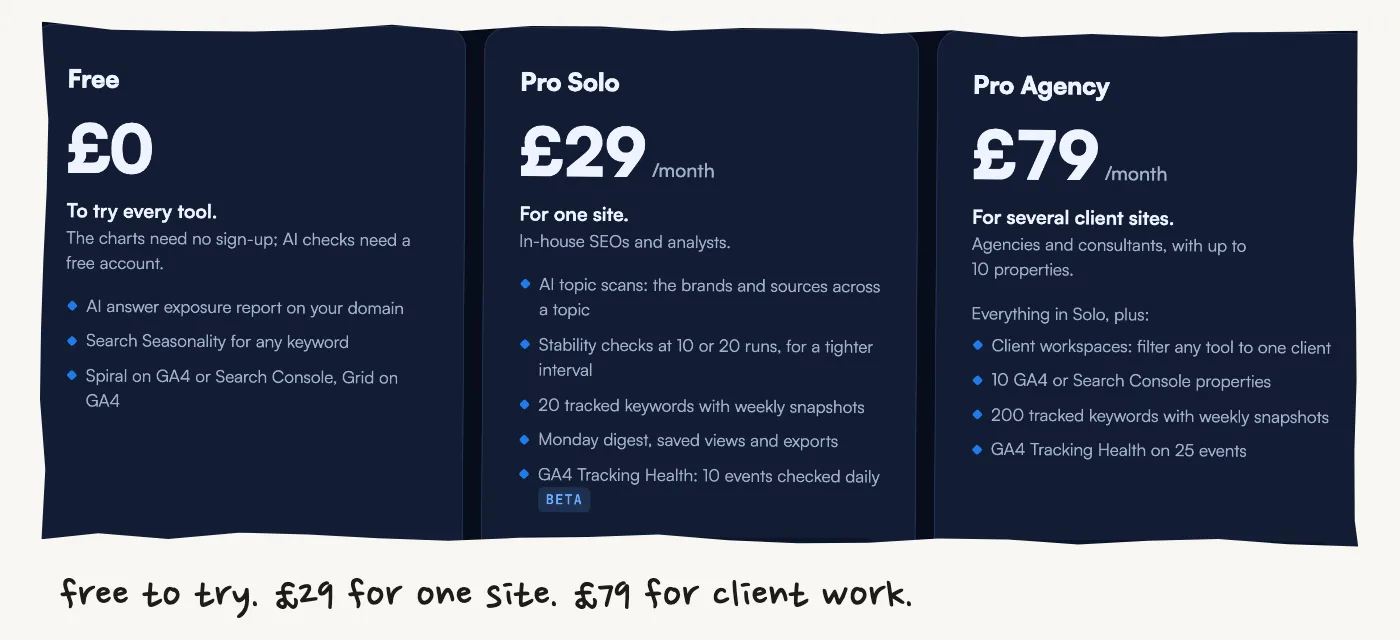
tracked keywords get a weekly snapshot, and a monday email lists the new domains in google's top 10 for them. solo tracks 20 keywords and agency tracks 200. their changelog says week-on-week changes were paused on october 6 while they verify a data source, so check that before you buy for this feature.
ga4 tracking health is in beta. it checks the events you choose every morning, and emails you once if one stops, drops sharply or starts counting twice. a slow week on its own doesn't trigger it.
each tool also gets deeper. seasonality takes bigger keyword sets and csv export, the spiral gets a year-on-year overlay and filters, and the grid can export an ad schedule for google ads. monitor adds topic scans, which show the brands and sources across a whole subject.
agency adds client workspaces and up to 10 connected ga4 or search console properties. on the beta, tracking health covers one ga4 property on either plan.
ai checks run on a shared pool of credits: 30 a month on free, 145 on solo, 400 on agency. a stability check costs more the more runs you buy, and the pricing page shows you why you might want them.
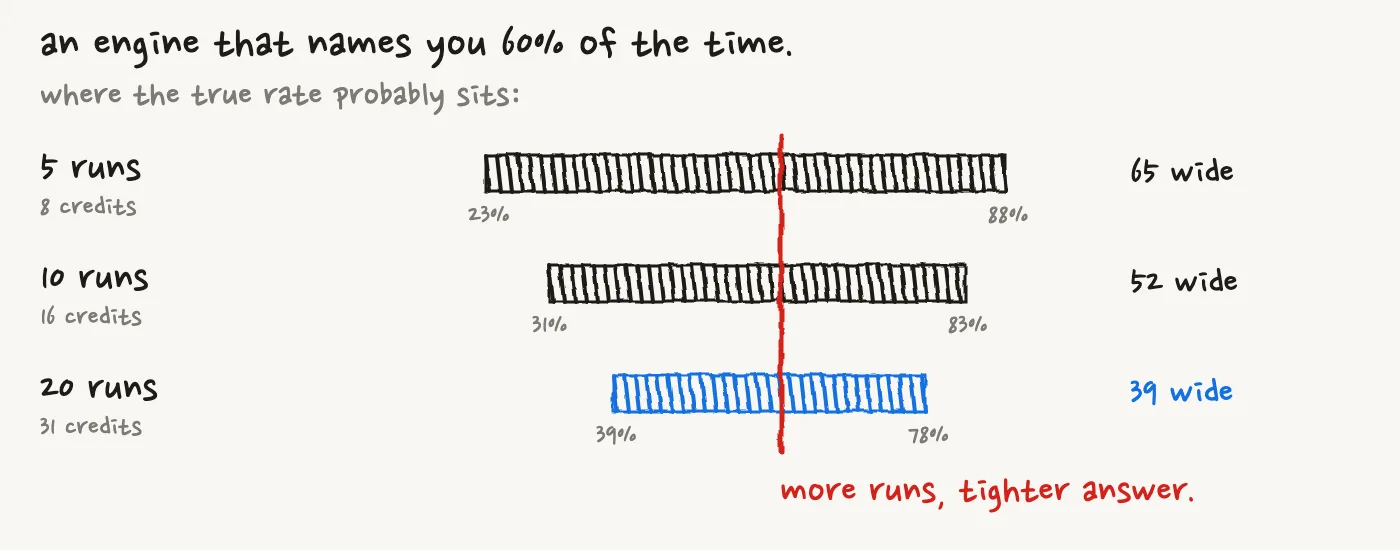
a prompt check costs 1 credit, and the exposure report uses none. monthly credits don't roll over, and a pack of 100 costs £20.
both paid plans have a 14-day trial with a card, and you can cancel before day 14 to pay nothing. the price shown has no vat added.
where your data goes
this is the part of the site we'd show a cautious client. it spells out three routes.
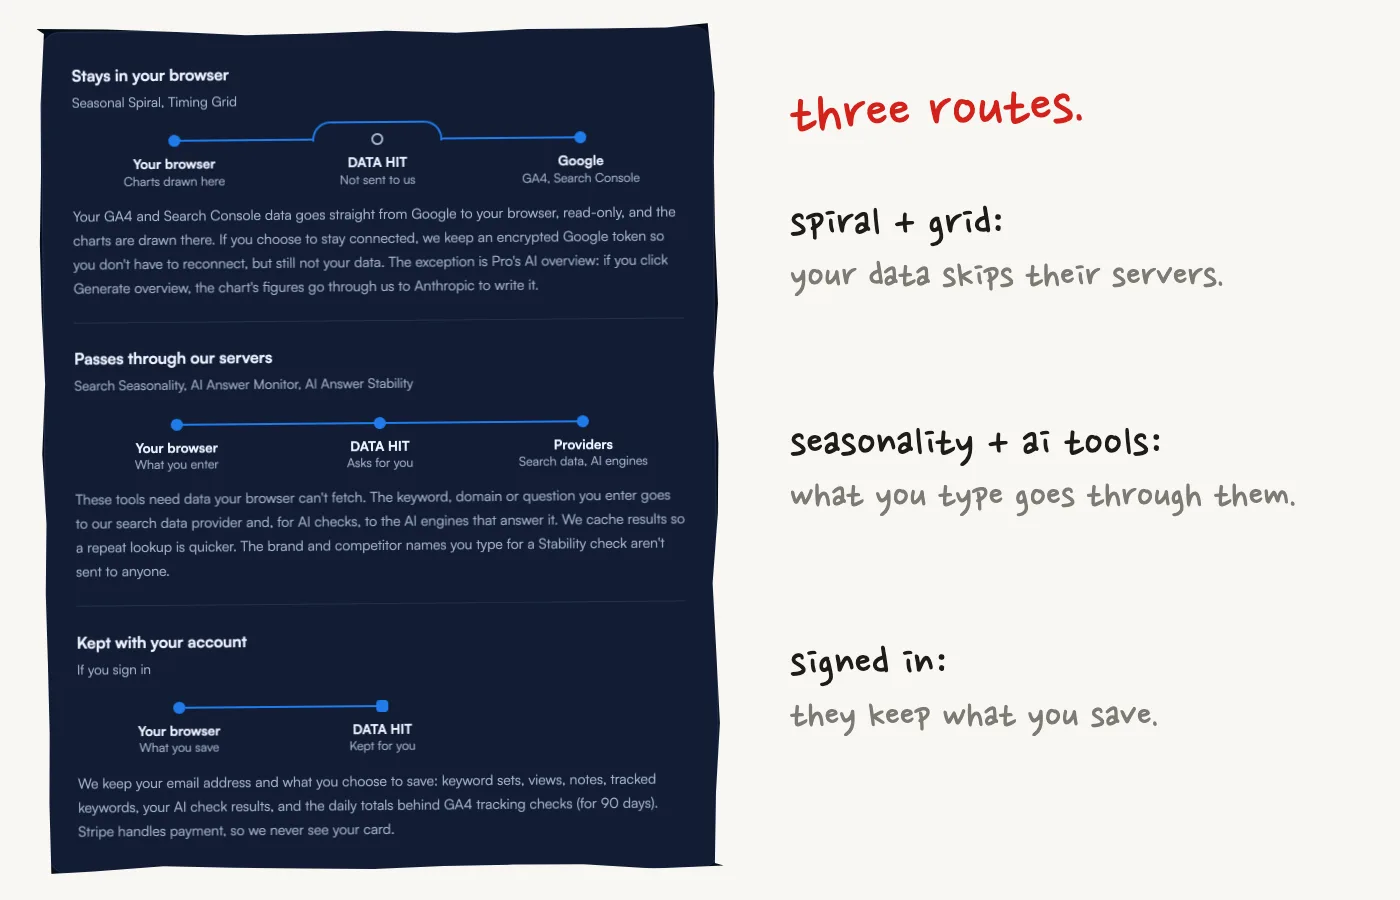
ga4 and search console data for the spiral and the grid goes from google straight to your browser, read-only, and the charts are drawn there. the exception is pro's ai overview, where the chart's figures go through them to anthropic if you press generate.
for seasonality and the ai tools, what you type passes through their servers to the search data provider or the ai engines. brand and competitor names in a stability check aren't sent to either.
if you sign in, they keep your email and what you save. tracking health keeps daily event totals for 90 days. stripe handles the card.
a few smaller things
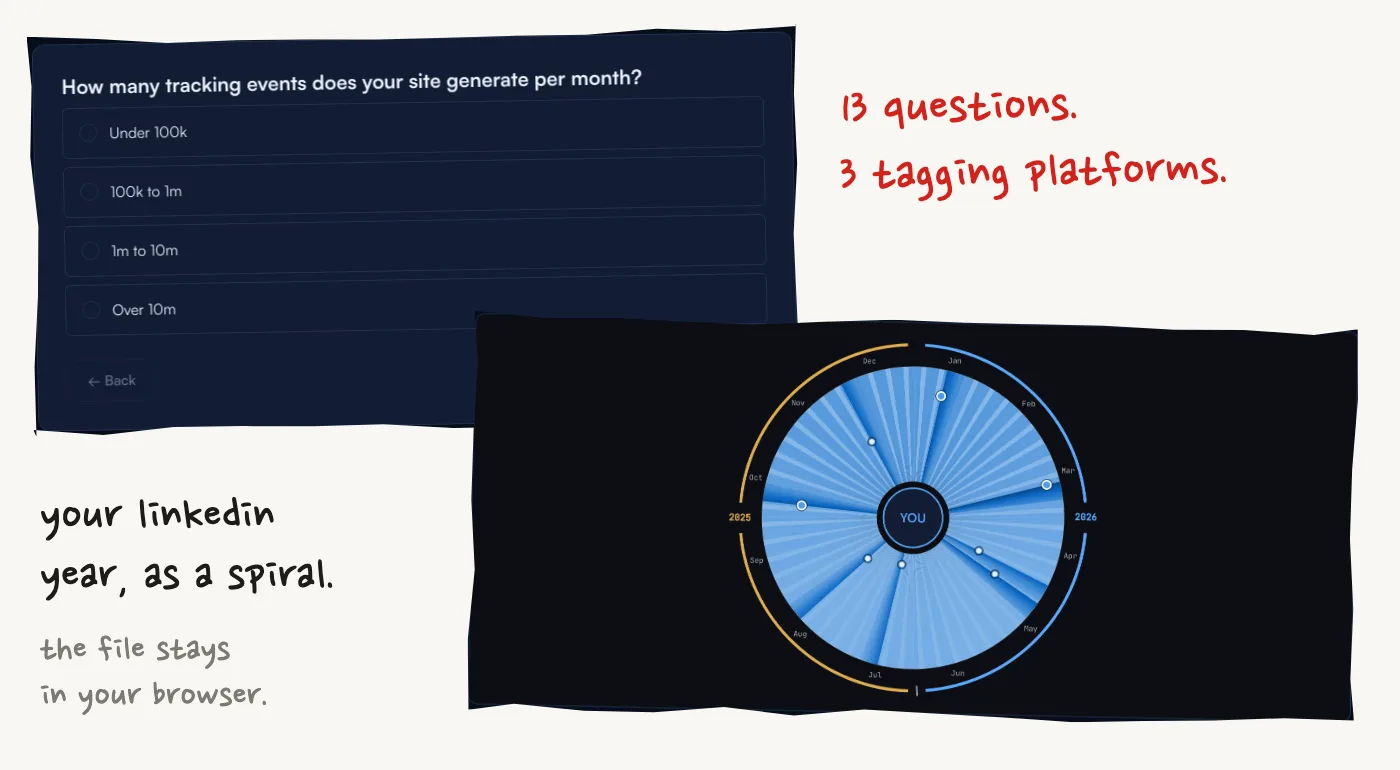
my linkedin year winds your linkedin analytics export into a spiral you can share. it's in beta and free, and the file is read in your browser.
the server-side tagging platform picker asks 13 questions about your stack, team and budget, then recommends addingwell, stape or taggrs.
there's a compare section too, with guides like how to see ga4 traffic by day and hour. data hit's own tools are marked, and it says there are no paid placements or affiliate links.
every tool also has a help page that defines its terms, which is handy when a client asks what a number means.
who it suits
seo and content agencies get the most from it. seasonality plans client content, monitor gives you something concrete to show about ai answers, and agency keeps clients in separate workspaces.
in-house marketers can use it to look into traffic drops and campaign timing. analysts get charts for ga4, search console or csv data that a line chart would flatten.
it suits you less if you want a dashboard. the team says the tools sit alongside semrush, ahrefs and data studio and don't replace them. their comparison of ai visibility tools also says otterly, peec ai and profound are the better pick if you want a big prompt set watched every day.
a good first test is one keyword in search seasonality, which needs no account. we ran 10 of them for when to publish seasonal content, if you want to see what the numbers look like.
Disclosure: This article was sponsored by DATA HIT as part of the dotstore Ultra plan.