when to publish seasonal content (your christmas post is already late)
we ran 10 uk search terms to see when demand really starts rising. christmas dinner starts in august. here's how to find the month for your own keywords, for free.
it's october 30, and plenty of people are starting their christmas post this week.
uk searches for "christmas dinner" started climbing in august.
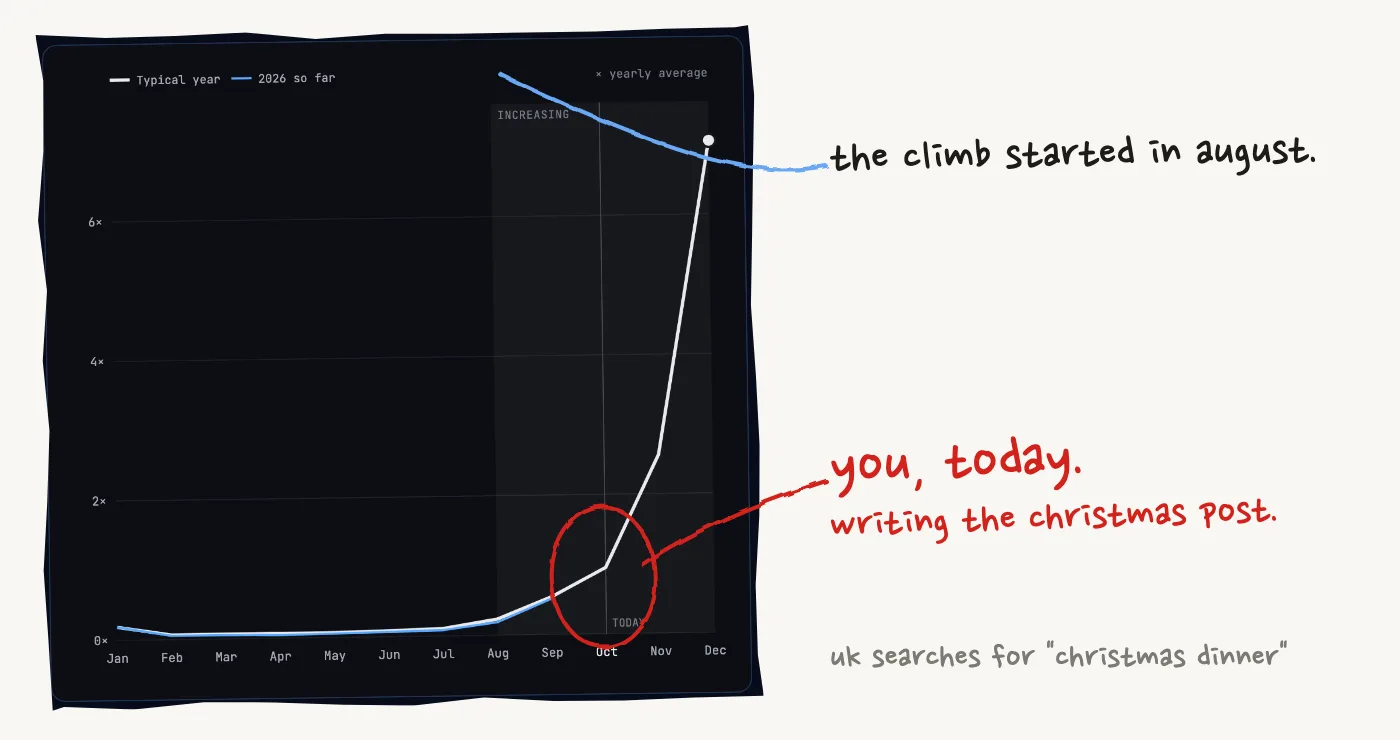
most content calendars are built around the day itself. the post goes out when the holiday feels close, because that's when somebody remembers it.
but a new page doesn't rank the day it goes live. by the time the peak arrives, the clicks go to pages that were already there when people started looking.
so the date you want is the month demand starts to rise. we wanted real numbers on that, so we ran 10 uk keywords through search seasonality, a free tool from data hit, a uk analytics consultancy. one keyword needs no account.
what 10 keywords showed us
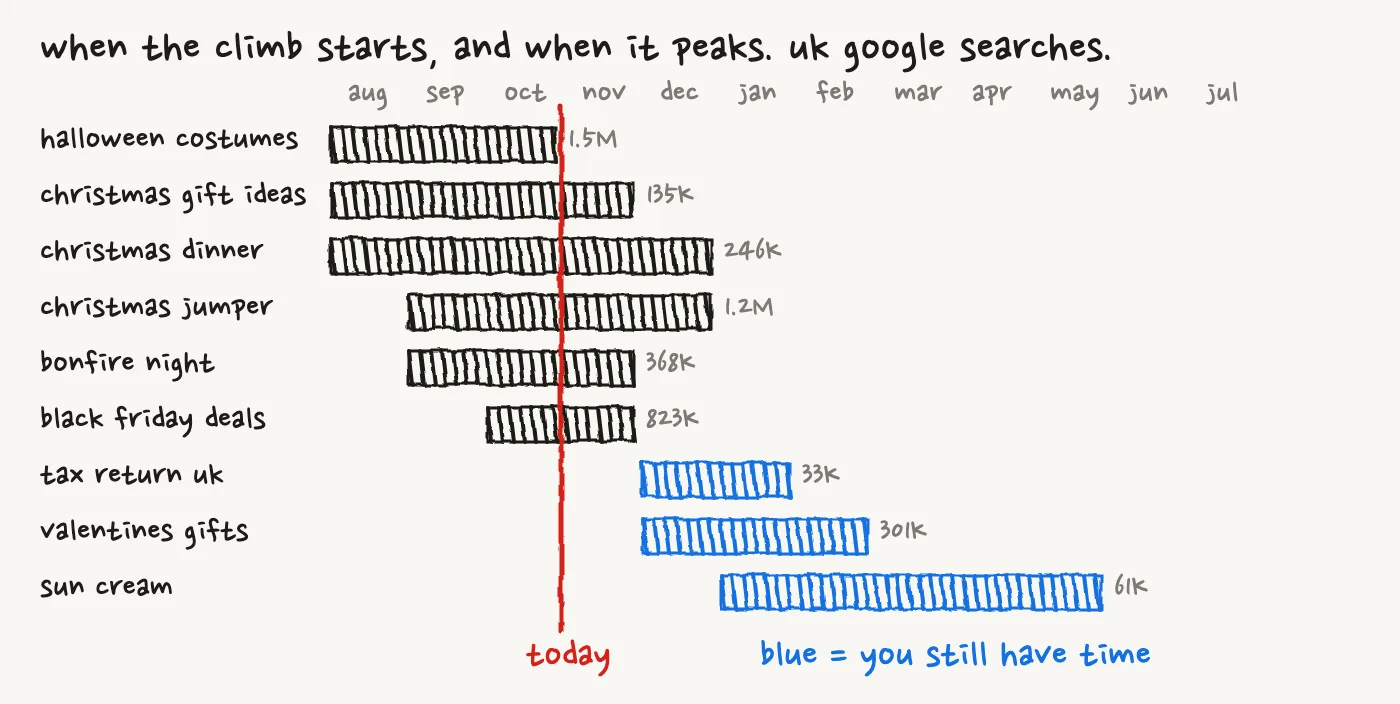
the tenth was "locksmith near me", which has no season at all. more on that below.
a few things surprised us.
the runway changes a lot between terms. "black friday deals" starts rising in october and peaks in november. "sun cream" starts in january and peaks in may.
"christmas gift ideas" peaks in november, a month before "christmas dinner". our guess is people sort the presents first and the food later.
"black friday deals" has the sharpest spike of the lot, 11.5× the yearly average. "sun cream" only reaches 2×.
"tax return uk" has a second, smaller peak in april on top of january, so one post a year may leave some of that demand on the table.
"increase starts" has an exact meaning here: the first month demand gets a quarter of the way from its low point to its peak, on a log scale. the help page lists every definition if you want to check the maths.
why eight years beats one
one year of data can't tell a season from a fluke.
the tool stacks about eight years of monthly searches into a spiral, one turn per year. a season that repeats lines up, and a one-off doesn't.
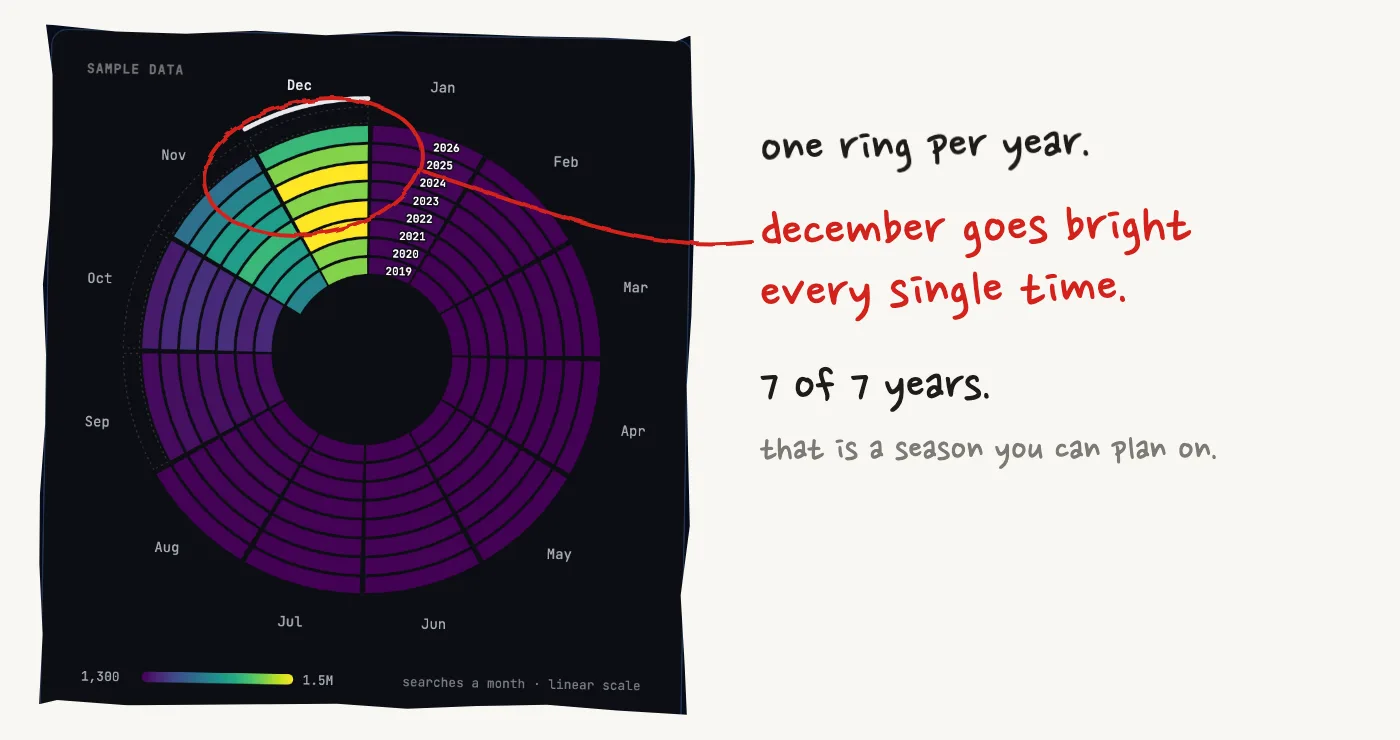
the same check also tells you when to trust a peak. "christmas jumper" peaked in december in 7 of 7 years. "sun cream" peaked in may in 4 of 7, and we'd guess the british weather has something to do with that.
so for sun cream we'd plan around a window of months and leave the exact week alone.
how to find your own month
open search seasonality, type a keyword and pick a country. there are 11 to choose from.
read the peak month, then the line under it that says how many years it held.
look at "increase starts". that's your deadline, and we'd aim to publish a few weeks ahead of it.
make a free account to paste 10 keywords at once. you get a calendar sorted by peak month, with what's rising now and what starts soon. pro takes 200, agency takes 700.
it has limits. the numbers are monthly, so it won't catch a spike from this week, and it only covers google search.
google trends is closer to real time. keyword planner gives you volumes straight from google, and it's where you'd go if you want to build the chart yourself in a spreadsheet. data hit's comparison of keyword seasonality tools lays out where each of them wins, including where theirs loses.
some keywords have no season
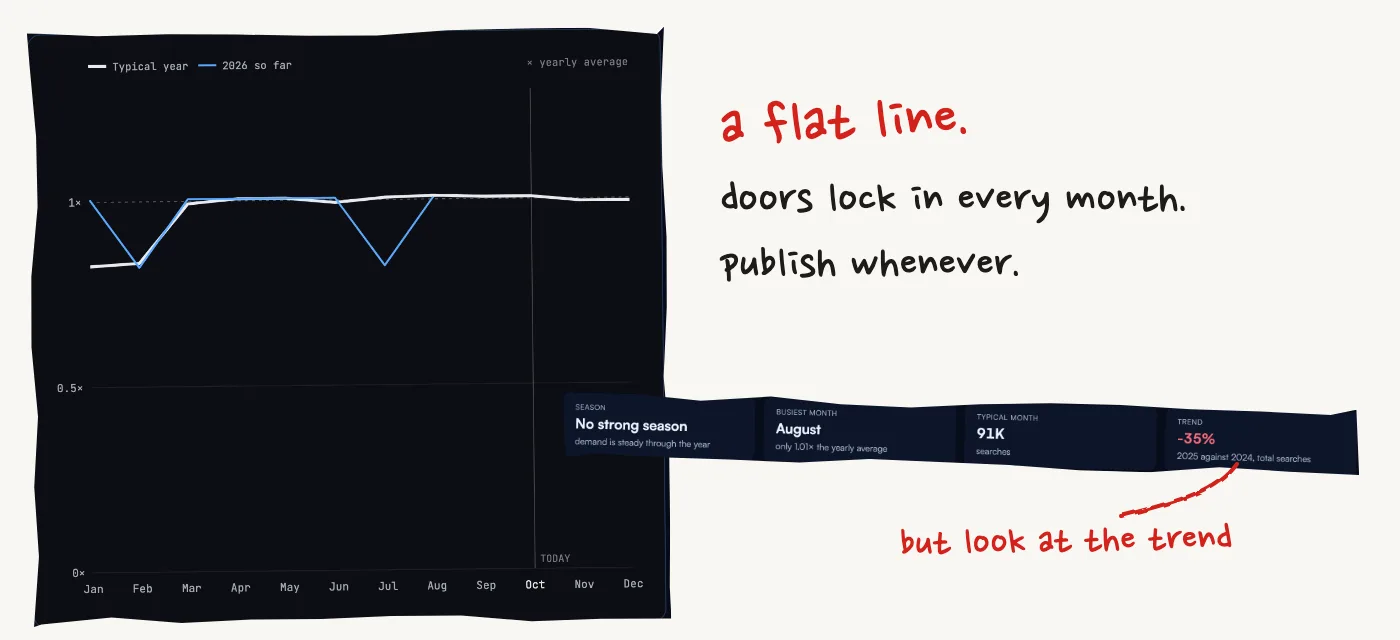
its busiest month is only 1.01× the yearly average. you can publish that page any week of the year.
the trend tile matters more for a term like this. total searches for it fell 35% from 2024 to 2025.
the seasonal ones have the same problem. a clean peak says nothing about whether the peak is shrinking. from 2024 to 2025, "valentines gifts" fell 27%, "christmas jumper" fell 19% and "halloween costumes" fell 18%.
keep in mind these are estimates. google rounds monthly volumes into bands and can merge close variants of a phrase, so trust the direction more than the exact figure.
if you're already late
go back to the calendar and find your bar.
black bar that crosses today: update the page you already have and keep its url. fix the dates, add what changed this year, and link to it from your busier pages.
black bar and no page: write it anyway if you need it, and treat this year as the head start for next year.
blue bar: you're on time. "tax return uk" and "valentines gifts" both start rising in december, so those are the ones to write now.
put a reminder in your calendar for july too. most of the christmas terms we checked were moving by august or september.
your own traffic has a calendar too
search demand is the market. your site can drift away from it.
seasonal spiral does the same trick with daily ga4 or search console data, one turn per year, so weekly rhythm and year-on-year shifts line up. on pro it can split branded from non-branded clicks. if non-branded clicks drop, it says which pattern fits: a ranking drop, fewer people searching, or google answering more of those searches on the results page.
timing grid goes smaller, ga4 traffic by day of week and hour. it's meant for scheduling ads, posts and outreach.
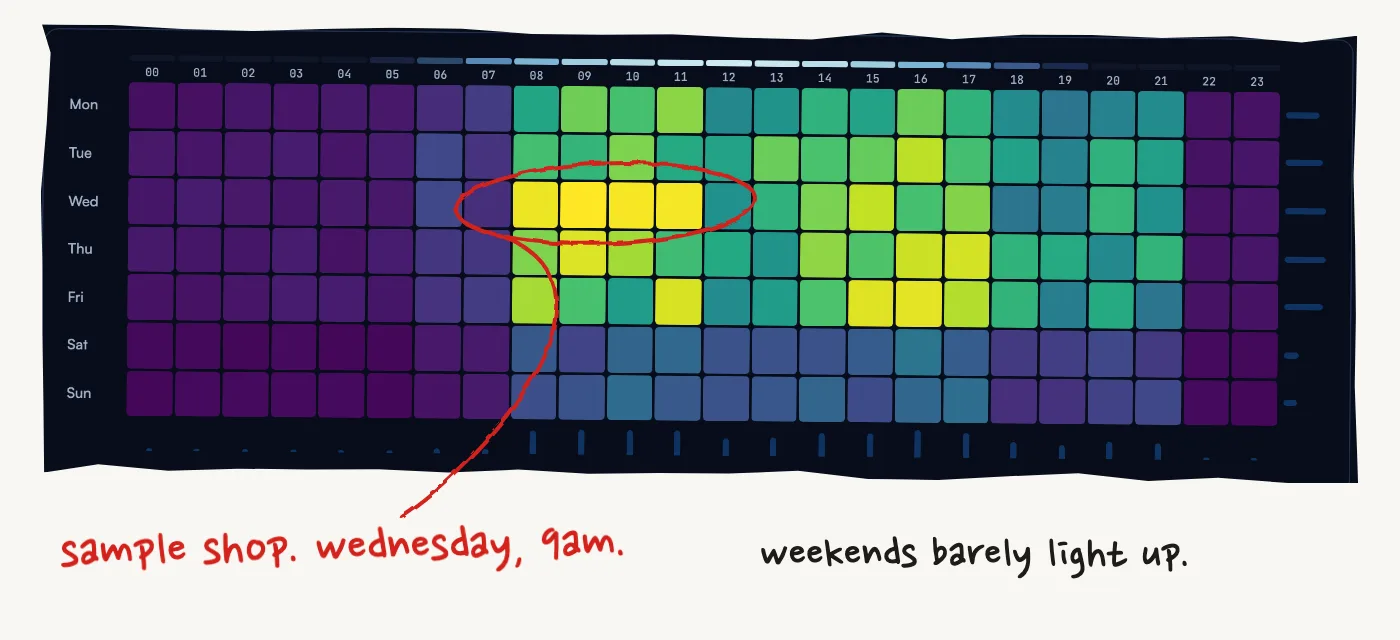
both open on sample data, so you can look around before connecting anything. when you do connect, your ga4 and search console data goes straight from google to your browser and the charts are drawn there.
the search might get answered before the click
being early helps less if google answers the question itself.
ai answer monitor shows how much of your search demand gets an ai answer above the results, and whether that answer links to you.
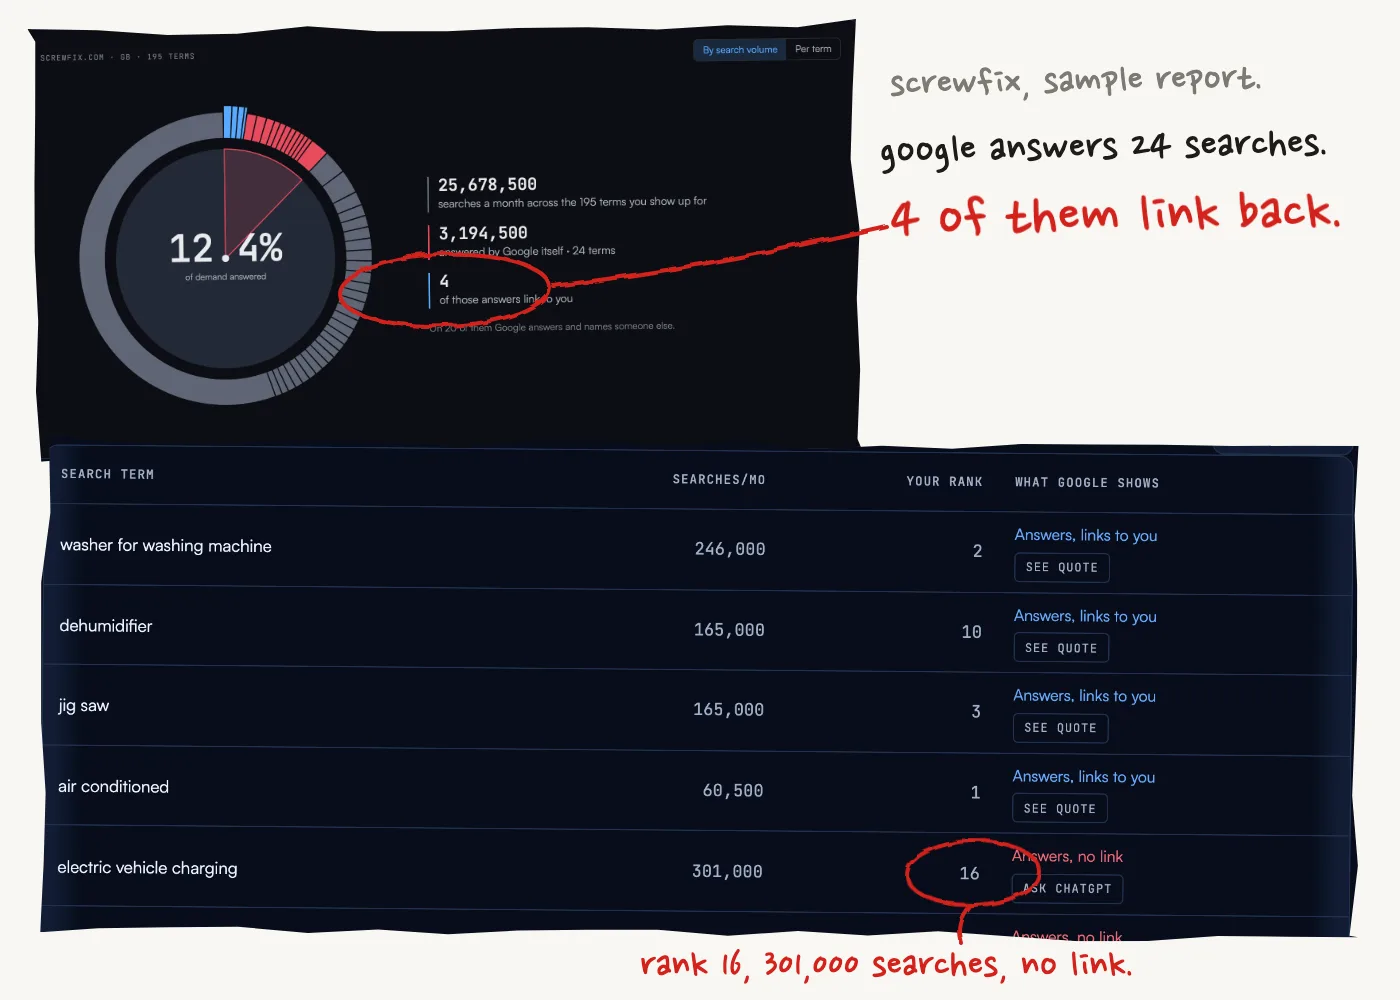
the line that stuck with us is under the chart in that report: rank is not what earns the link. screwfix gets a link at rank 10 for "dehumidifier", then none at rank 16 for "electric vehicle charging", a term with 301,000 searches a month.
ai assistants are harder to measure, because they change their answer between runs.
ai answer stability asks chatgpt, gemini, perplexity, claude and google ai mode the same question several times, then counts how often each one names you.
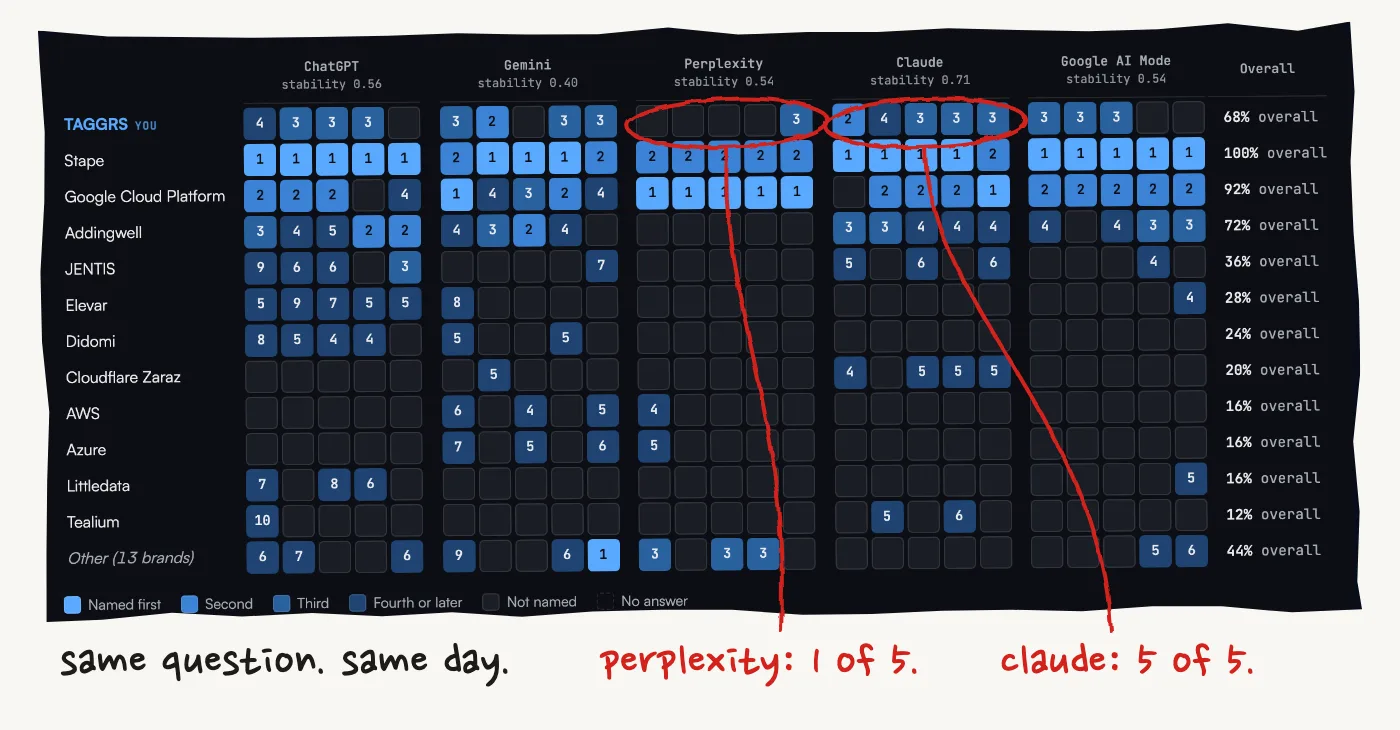
in that sample, taggrs was named in 68% of 25 answers, with a 95% interval of 48% to 83%. the tool flags that as too wide to report, which is a refreshing thing for a visibility tool to admit.
it's in beta, and these are api answers, so they can differ from what someone sees in the chatgpt app.
what it costs
the charts are free and a lot of them need no sign-up. a free account adds 30 ai credits a month, enough for about 3 stability checks.
pro solo is £29 a month and pro agency is £79. agency adds client workspaces and up to 10 connected ga4 or search console properties. both have a 14-day trial, and the trial needs a card.
it comes out of matthew redford's consultancy. these were the charts the team kept wanting in client work and couldn't find. the site says plainly that it sits alongside semrush and ahrefs and doesn't replace them.
two things to know before paying. stability checks run when you press the button, so it won't watch hundreds of prompts every day. and data hit paused week-on-week ranking changes on october 6 while it checks a data source, so look at the changelog to see where that stands.
the free test takes a minute. pick the keyword your next big post depends on and see which month it starts moving.
Disclosure: This article was sponsored by DATA HIT as part of the dotstore Ultra plan.