Self-hosted alternatives to 0x.tools
200 self-hosted apps like 0x.tools, closest match first.
Top picks
- P

Pyroscope
LaunchPyroscope is an open-source continuous profiling platform designed to help you debug performance issues down to a single line of code. By integrating seamlessly with your existing observability stack, Pyroscope provides deep insights into y
Self-hosted
- S

socktop
Launchsocktop is a beautiful, TUI-first remote system monitor built with Rust. Monitor your Linux systems in real-time with an elegant terminal interface featuring the Catppuccin Frappe theme.
Self-hosted
- S

Status
LaunchSimple, lightweight, web-based system monitoring tool for small homeservers running Linux.
Self-hosted
- H

HyperDX
LaunchHyperDX is an open-source observability platform that unifies session replays, logs, traces, metrics and errors in one place. It traces a request from the user's browser or phone through your backend servers and async workers, and links ses
Self-hosted
- R
Rails Performance
LaunchRails Performance is a self-hosted tool that monitors the performance of a Ruby on Rails application. The author describes it as a simple and free alternative to New Relic APM, Datadog and similar services. On the Recent tab it shows real-t
Self-hosted
- H

Highlight
LaunchComprehensive monitoring solution offering error tracking, session replay, and performance insights for seamless debugging and optimization.
Self-hosted
More like 0x.tools
glances system monitoring
Glances is a cross-platform system monitoring tool written in Python











Sentry Self-Hosted
Powerful error tracking platform with wide language support and a robust API

Speed Test by OpenSpeedTest™
HTML5 Network Performance Estimation Tool. (Source Code) MIT Docker










About 0x.tools
0x.tools
X-Ray vision for Linux systems
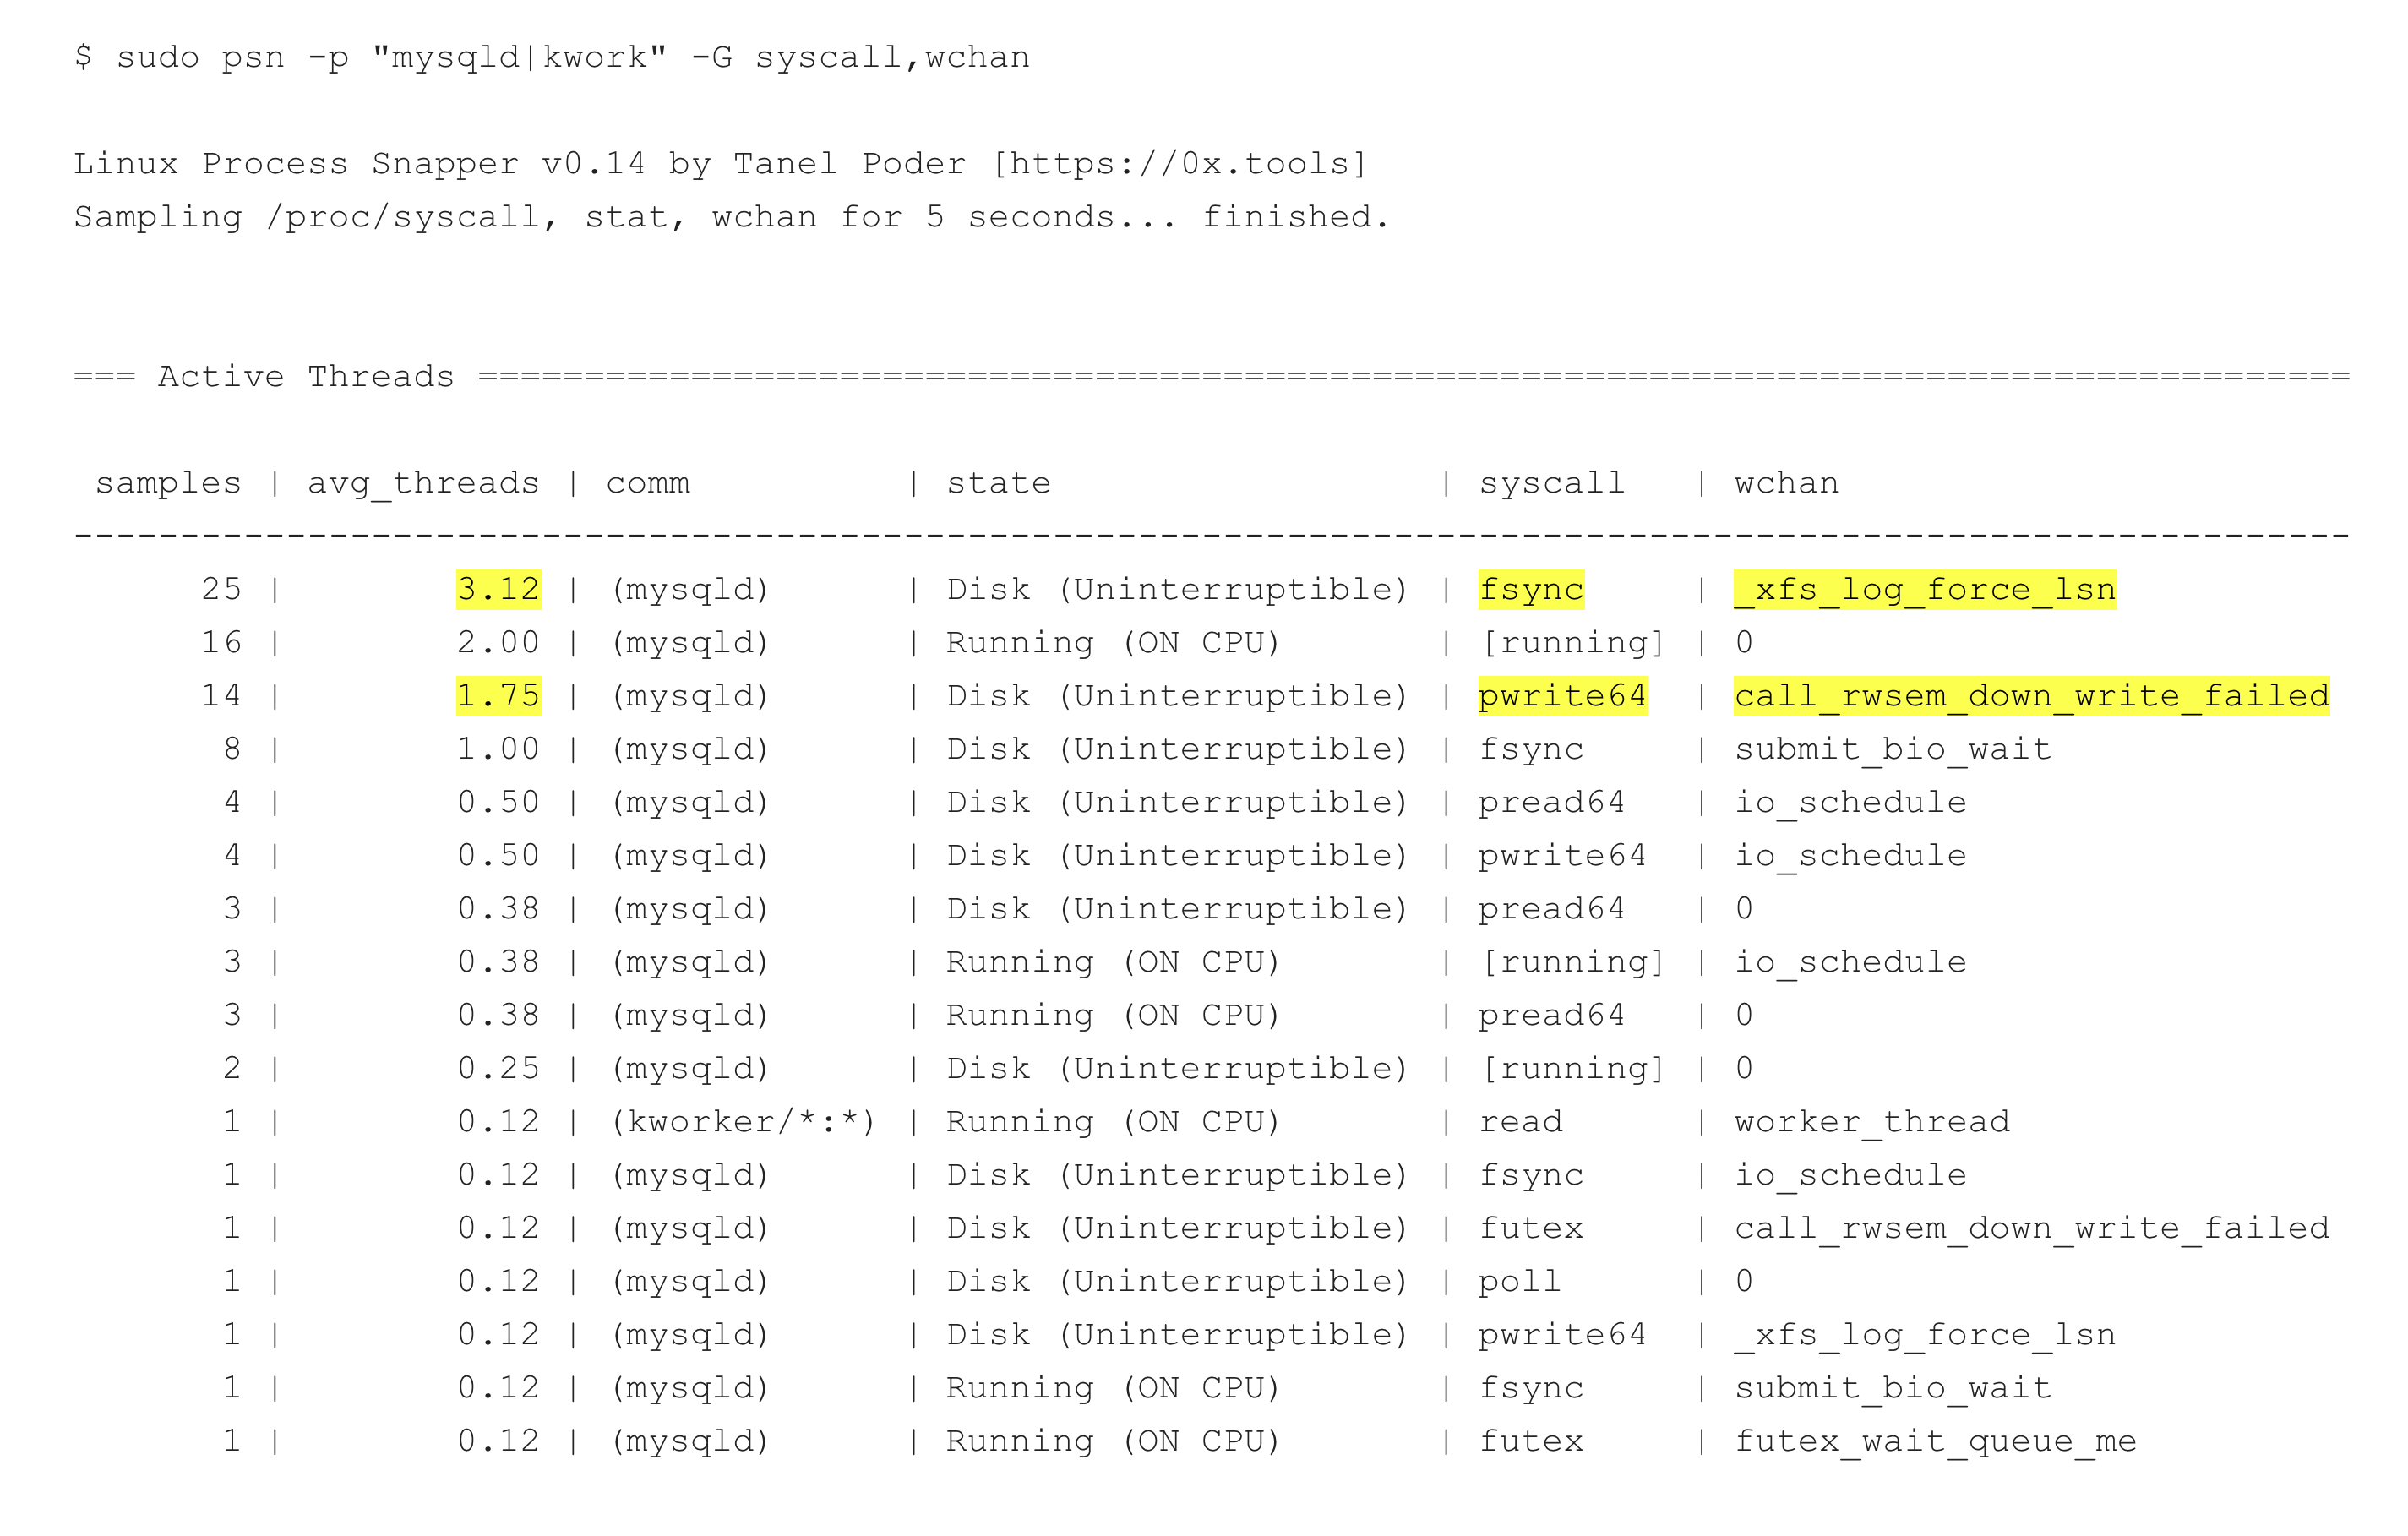
0x.tools is a set of open source utilities for analysing application performance on Linux, written by Tanel Poder. The goal is simple deployment with minimal dependencies, so you do not need to install kernel modules or a heavy monitoring framework to start troubleshooting. The tools measure activity at the level of individual threads, including executed code, sleep states, system calls and wait locations. They do this by tracking events and sampling them at the right moments, rather than tracing every event. The flagship tool, xtop, is like the Linux top command but adds wall-clock time views and can drill down into a thread's activity or into kernel events such as lock waits and memory stalls. Other included tools cover process snapshots, scheduler latency and CPU profiling. The site links to conference talks and short demonstrations, and it has an FAQ on licensing, measurement overhead and whether the tools are safe in production. The project lives on GitHub, where discussions are open.
- Price
- Open source
- Category
- Reading
- Website
- 0x.tools