Skip to content
0x.tools

Free alternatives to 0x.tools

200 free apps like 0x.tools, closest match first.

Top picks

  1. 0

    0xtools

    Launch

    Tools is a set of performance analysis tools for Linux, and xCapture is the first of them to use modern eBPF. xCapture samples thread activity on a Linux system and writes the results to hourly CSV files for analysis, with a companion tool,

  2. P

    PerfSpect

    Launch

    PerfSpect is an open-source command-line performance suite for Linux, published by Intel. It helps system administrators, developers and performance engineers analyze and tune both a server and the software running on it. The tool has seven

  3. S

    Sysstat

    Launch

    sysstat is a set of performance monitoring tools for Linux. It bundles utilities that are common to many commercial Unix systems for watching system performance and usage. iostat reports CPU statistics and input and output statistics for bl

  4. G

    Gtop

    Launch

    gtop is a system monitoring dashboard for the terminal. It shows live views of your machine's CPU, memory and process activity in a single screen, so you can check on a server or a workstation without leaving the command line. You start it

  5. P

    Pachtop

    Launch

    Pachtop is an open-source system monitor built with Rust and Tauri, meant to be a more modern and lighter alternative to older tools. Its dashboard shows real-time system metrics, including CPU, RAM, swap, disk and network usage. You can mo

  6. P

    Performance Co-Pilot, or PCP, is a toolkit for analysing system performance. It collects metrics from your systems with a lightweight design and can gather metrics from multiple hosts and several operating systems in one place. The project

More like 0x.tools

7
N

Neohtop

🏻 Blazing-fast system monitoring for your desktop

Launch
8
P

perf-profiler

Profiling CPU/memory hot paths, generating flame graphs

Get
9
P

Pyroscope

Debug performance issues down to a single line of code

Launch
10
O

Osquery

SQL powered operating system instrumentation, monitoring, and analytics

Launch
11
P

performance-profiling

Guide performance profiling for Apple platform apps

Get
12
K

Kula

Lightweight, self-contained Linux server monitoring tool

Launch
13
T

TuxManager

It's like Windows Task Manager, but for GNU/Linux

Launch
14
M

Mission Center

Monitor your CPU, Memory, Disk, Network and GPU usage

Launch
15
S

Speedscope

A fast, interactive web-based viewer for performance profiles

Launch
16
L

Linnix

eBPF-powered Linux observability with AI incident detection. AGPL-3.0 licensed

Launch
17
P

Parca

Continuous profiling for analysis of CPU and memory usage

Launch
18
M

MenuMeters

A set of CPU, memory, disk, and network monitoring tools for macOS

Launch
19
P

psutil

Cross-platform lib for process and system monitoring in Python

Launch
20
F

FindDiskKiller

See what keeps using your disk

Launch
21
H

Httpinspect

top, but for the HTTP endpoints on your host

Launch
22
H

htop

An interactive process viewer for Unix

Launch
23
M

Mactop

Apple Silicon Monitor Top

Launch
24
M

Mac Performance Monitor

A diagnostic performance logging utility for macOS: logs CPU, memory, GPU

Launch
25
A

argent-native-profiler

Native profiling for CPU hotspots, UI hangs, memory issues

Get
26
M

Mactop

Apple Silicon Monitor Top

Launch
27
T

Tophat

View CPU, memory, disk, and network activity in the GNOME top bar

Launch
28
P

Podtrace

eBPF-driven APM and diagnostic tool for Kubernetes applications

Launch
29
B

Bottom

Yet another cross-platform graphical process/system monitor

Launch
30
M

Monitorix

Monitorix is a free, open source, lightweight system monitoring tool

Launch
31
A

agent-performance-optimizer

Agent skill for performance-optimizer - invoke with $agent-performance-optimizer

Get
32
D

Deepops

Observe any stack, any service and any data

Launch
33
W

Witr

Why is this running? Trace any process, port, container

Launch
34
T

Ttop

System monitoring tool with historical data service, triggers and top-like TUI

Launch
35
P

Portop

htop for your ports. Inspect processes, Docker & systemd, detect port drift

Launch
36
P

picosnitch

Per-executable network bandwidth monitoring for Linux

Launch
37
K

Kindling

eBPF-based Cloud Native Monitoring Tool

Launch
38
P

PCM

Intel Performance Counter Monitor (Intel PCM)

Launch
39
A

appstat

Process Monitor for Windows

Launch
40
S

System Monitoring Center

Multi-featured system monitor

Launch
41
O

Oryx

TUI for sniffing network traffic using eBPF on Linux

Launch
42
D

Digma

Digma helps you fix performance issues in your code

Launch
43
S

socktop

A TUI-first remote system monitor

Launch
44
V

Vkit

Tools and Scripts for Linux VPS

Launch
45
P

ProcessSpy

Monitor macOS Processes Like a Pro

Launch
46
N

Ngxtop

Real-time metrics for nginx server

Launch
47
R

Rezolus

High-resolution, low-overhead systems and service telemetry

Launch
48
B

Brook

A cross-platform programmable network tool

Launch
49
H

HardwareVisualizer

A cross-platform hardware monitor with real-time metrics, local history, and…

Launch
50
S

Systrack

Linux kernel syscall implementation tracker

Launch

About 0x.tools

0

0x.tools

X-Ray vision for Linux systems

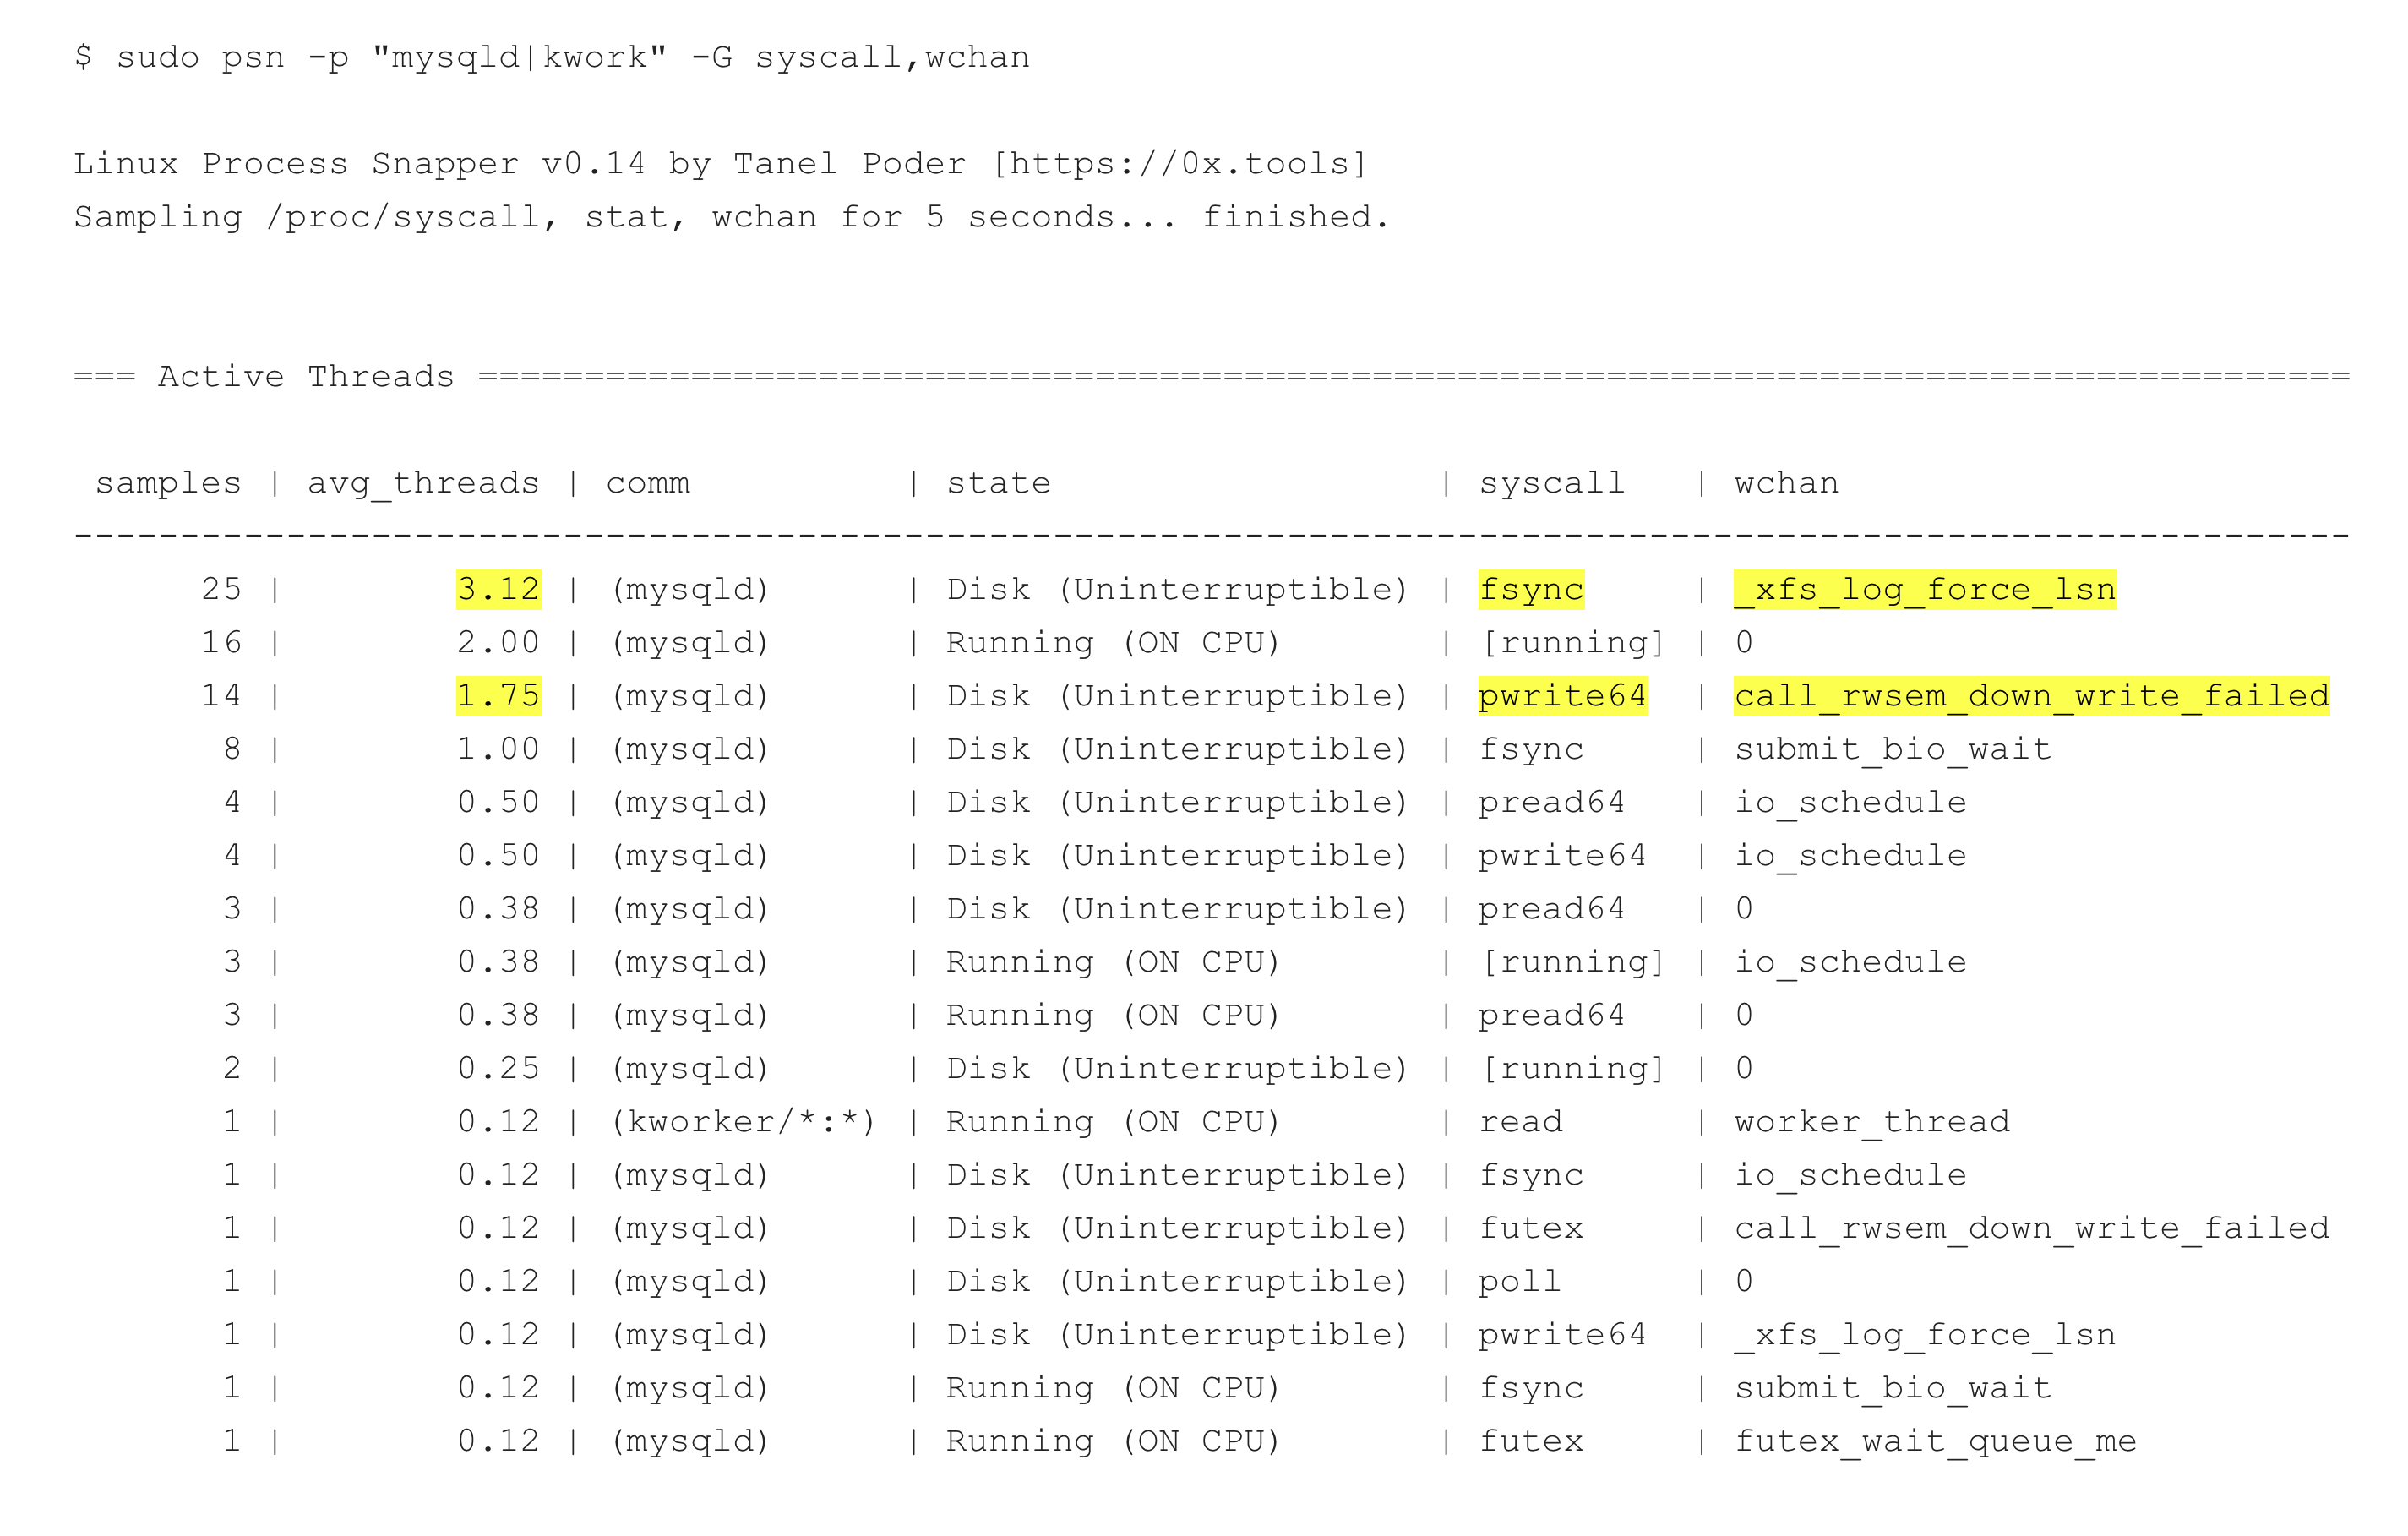
0x.tools is a set of open source utilities for analysing application performance on Linux, written by Tanel Poder. The goal is simple deployment with minimal dependencies, so you do not need to install kernel modules or a heavy monitoring framework to start troubleshooting. The tools measure activity at the level of individual threads, including executed code, sleep states, system calls and wait locations. They do this by tracking events and sampling them at the right moments, rather than tracing every event. The flagship tool, xtop, is like the Linux top command but adds wall-clock time views and can drill down into a thread's activity or into kernel events such as lock waits and memory stalls. Other included tools cover process snapshots, scheduler latency and CPU profiling. The site links to conference talks and short demonstrations, and it has an FAQ on licensing, measurement overhead and whether the tools are safe in production. The project lives on GitHub, where discussions are open.

Price
Open source
Category
Reading
Website
0x.tools